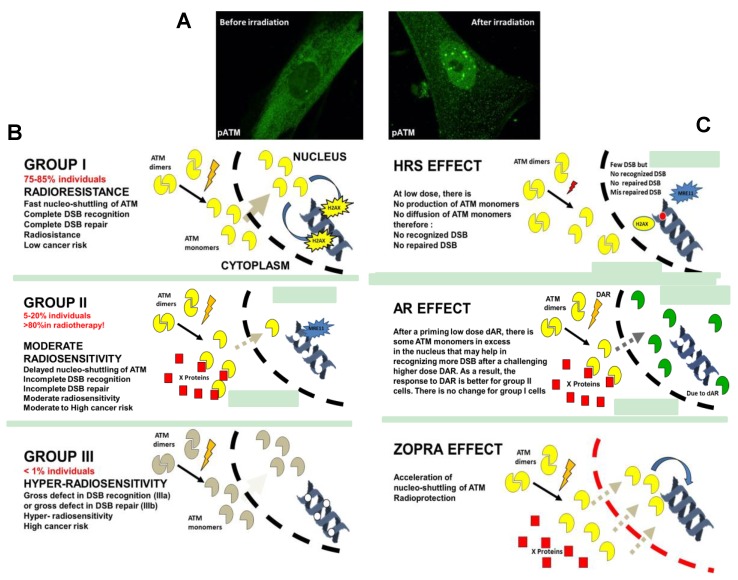
Figure 3.
The radiation-induced ATM nucleoshuttling (RIANS) model and its applications. (A) Representative image of pATM immunofluorescence before or after irradiation (2 Gy) in human normosensitive control fibroblast cell lines. (B) Schematic illustration of the three groups of radiosensitivity defined from the RIANS model. (C) Schematic illustration of the hyperradiosensitivity to low doses (HRS) and the adaptive response (AR) phenomena and of the effect of the combination of statins and bisphosphonates (zoledronate+pravastatin, (ZOPRA)) on the RIANS. Since the link between radiosensitivity and the nuclear membrane permeability is still unknown, membranes are represented in the same manner.

