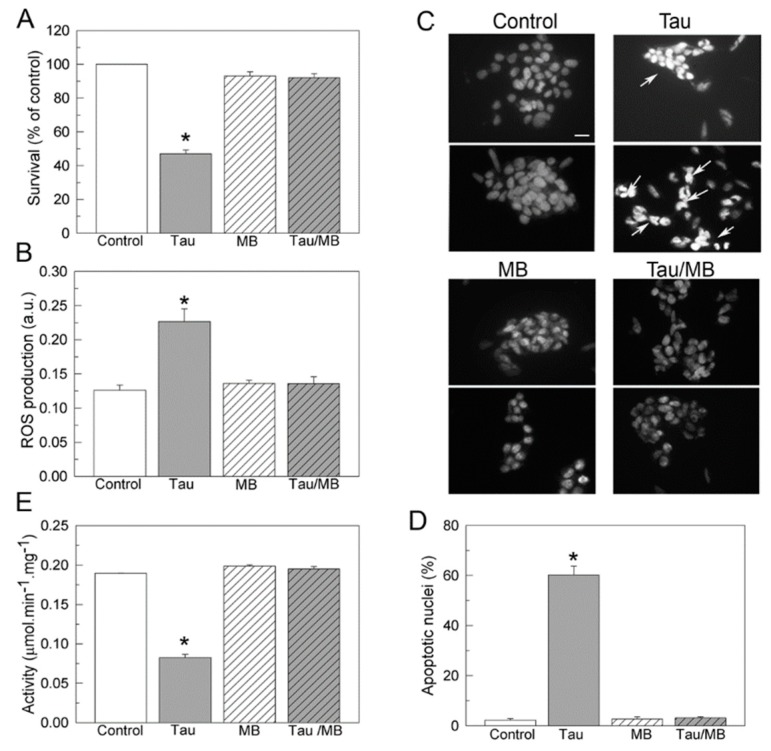
Figure 5.
Effects of tau and MB on cell viability (A), ROS production (B), apoptosis (C,D), and Ca2+-ATPase activity (E), in human SH-SY5Y neuroblastoma cells. Cells were growing in the absence or presence of 10 nM tau, without or with 10 nM MB, as detailed in Materials and Methods. (A) Cell viability was measured in control and treated cells after 1 h incubation with 150 μg/mL MTT. The viability of cells treated with tau decreased to 50% of that of the control group, but increased to the same control level when co-treated with tau and MB. Values are expressed as the percentage of the untreated control cells and represented as mean ± SE of at least five independent experiments. (B) ROS production was assayed in control and treated cells after 30 min incubation with 40 μM H2DCFDA (ROS sensitive fluorescent dye). (C) Ca2+-ATPase activity was assayed in 10 μg of membranes prepared from SH-SY5Y cells, previously treated as indicated above. The total Ca2+-ATPase activity was measured as indicated in the method. Data represent mean ± SE of four experiments performed in duplicate from three cell cultures. (C) Fluorescence microscopy of DAPI staining in controls and cells incubated with tau or/and MB. The panel shows representative images of apoptotic nuclei identified by condensed chromatin and nuclear fragmentation (white arrows). Scale bar: 10 μM (D) Quantification of apoptotic nuclei with respect to the total number of seeded cells in each type of culture. Values are mean ± SE of ten images per coverslip, obtained from four independent cultures. * p < 0.001 vs control cells.

