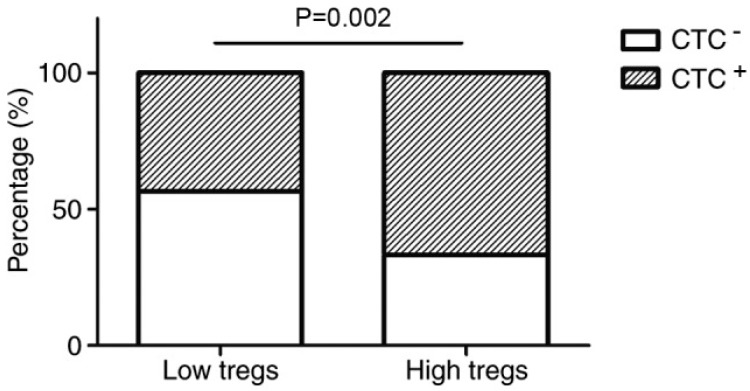
Figure 2.
The relationship between regulatory T cells (Tregs) and circulating tumour cells (CTCs) in patients with breast cancer. The shaded region of the bars represents the percentage of individuals in the group that had CTCs. Individuals with a high number of Tregs were more likely to be CTC-positive than those that had a low number, and this result was significant (67% in contrast to 43%, p = 0.002) [34].

