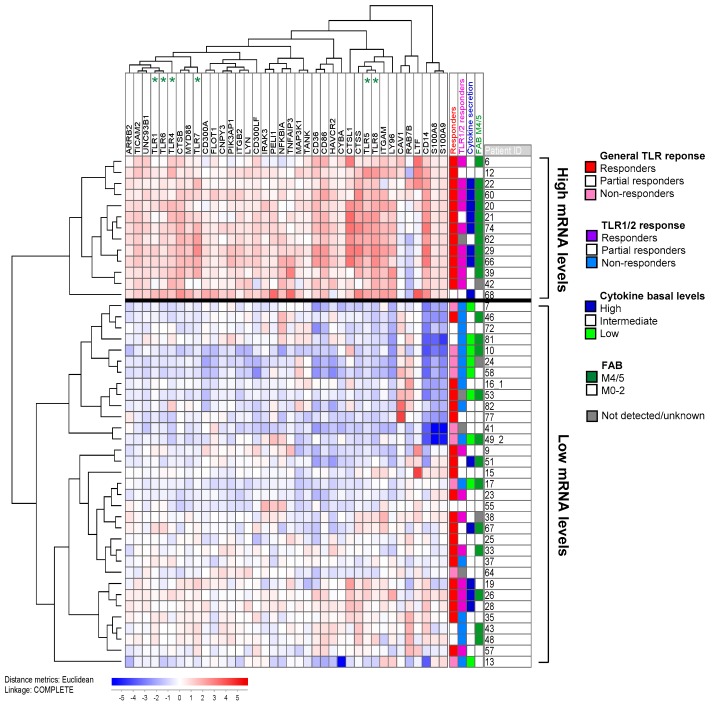
Figure 3.
A cluster containing the 38 out of 129 genes belonging to the GO-term “TLR signaling” (based on the AmiGO database) that were most differentially expressed among the 46 unselected patients in our study. The remaining genes, including TLR2, showed only minor variations among patients and did not differ significantly between the two identified clusters. Six of the ten TLR receptors showed differential expression (i.e., were included among the 38 genes) and are indicated at the top of the figure. All values were median normalized and log2-transformed, thus red and blue color indicate values above and below the median, respectively. The most differentially expressed genes were the TLR4 co-receptor CD14, and the TLR4 ligands S100A8 and A9 (on the far right). Patient distribution in the cluster was correlated with response upon TLR induction, especially by the TLR1/2 ligand Pam3CSK4, basal cytokine secretion levels and monocytic cell differentiation according to the FAB system. The numbers behind the patient ID correspond to the de novo sample (1) and the relapse sample (2) for patients with cells sampled at dual time points. All cells included in this analysis were gradient-separated and cryopreserved primary AML cell as described in Section 4.1. mRNA was prepared immediately after thawing without any kind of cell stimulation/incubation.

