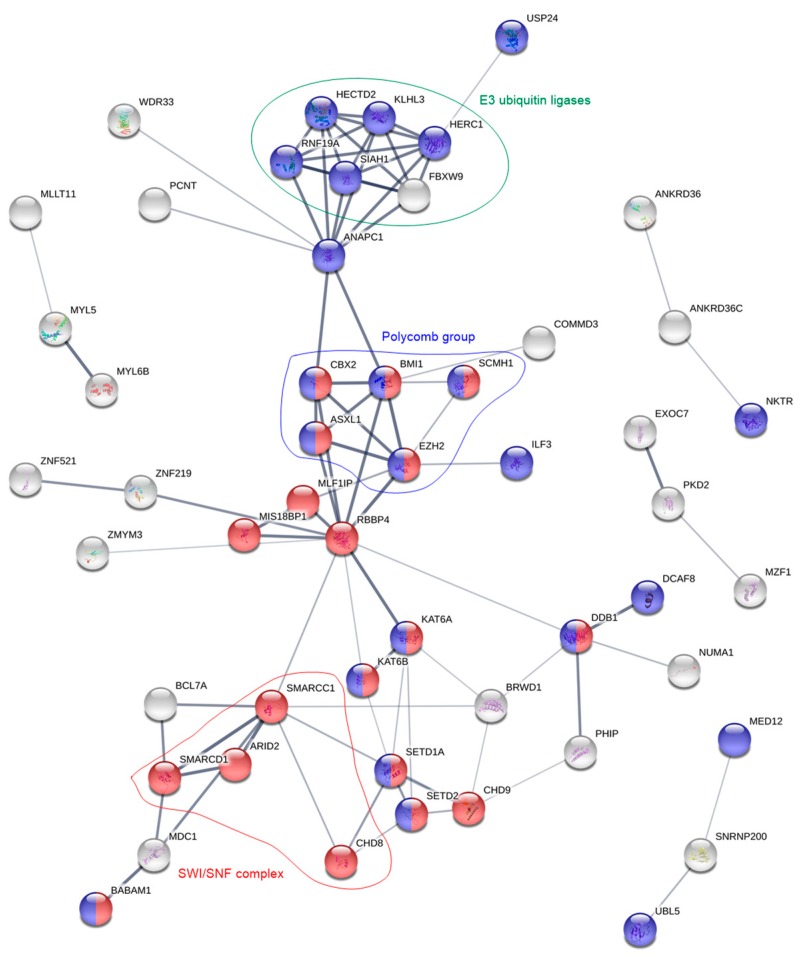
Figure 4.
Protein network analysis of the overexpressed genes in the TLR non-responsive patient cells. For clarity, the figure only contains proteins that are interrelated with at least two other proteins. Red and blue color correspond to the GO-terms “chromatin modification” and “cellular protein modification process”, respectively. Groups of proteins with identical functions (E3 ubiquitin ligases, green) or that are part of the same protein complexes (polycomb, blue; SWI/SNF, red) are highlighted.

