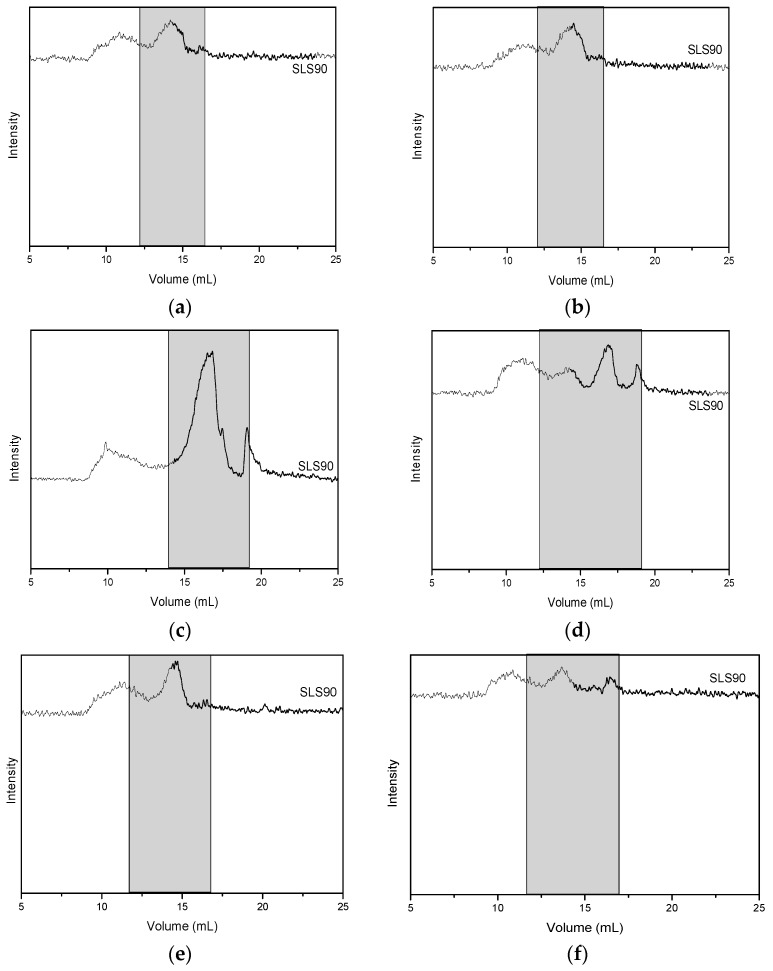
Figure 1.
Size exclusion chromatograms of the extracts obtained from non-composted mixtures on the left column (a,c,e) and size exclusion chromatograms of the extracts obtained from partially composted mixtures on the right column (b,d,f). Top to bottom: Extracts obtained at pH 5 (a,b), pH 7 (c,d), and pH 9 (e,f). The greyed out areas highlight the regions of significant UV absorbance at 280 nm.

