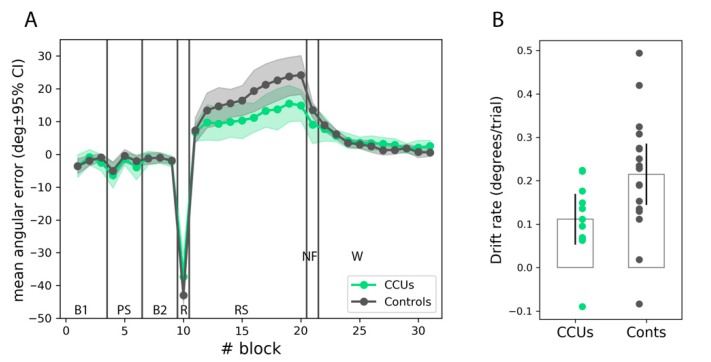
Figure 2.
Motor adaptation in chronic cannabis users (CCUs) and control participants (Conts). (A): Evolution of the average error. Vertical lines separate different phases of the experiment, indicated by the labels: B1, first baseline period; PS: practice strategy; B2: second baseline period; R: rotation; RS: rotation plus strategy; NF: no feedback washout; W: regular washout. (B): Rate of error increase in the RS phase. Shaded areas and error bars indicate the 95% confidence interval of the mean.

