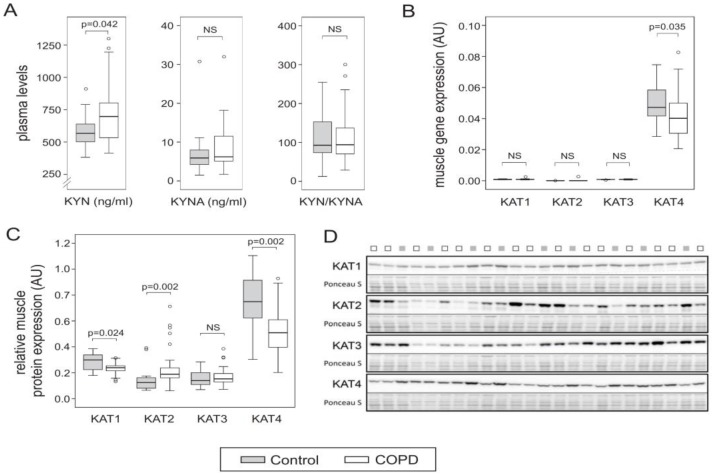
Figure 1.
Boxplots representing (A) Kynurenine (KYN) and kynurenic acid (KYNA) plasma levels and ratio, (B) muscle kynurenine aminotransferases (KAT)1–4 gene expression levels, and (C) muscle KAT1–4 protein expression levels. (D) Representative Western blot of KAT1–4 and corresponding PonceauS staining (300–20 kD range). NS, not significant.

