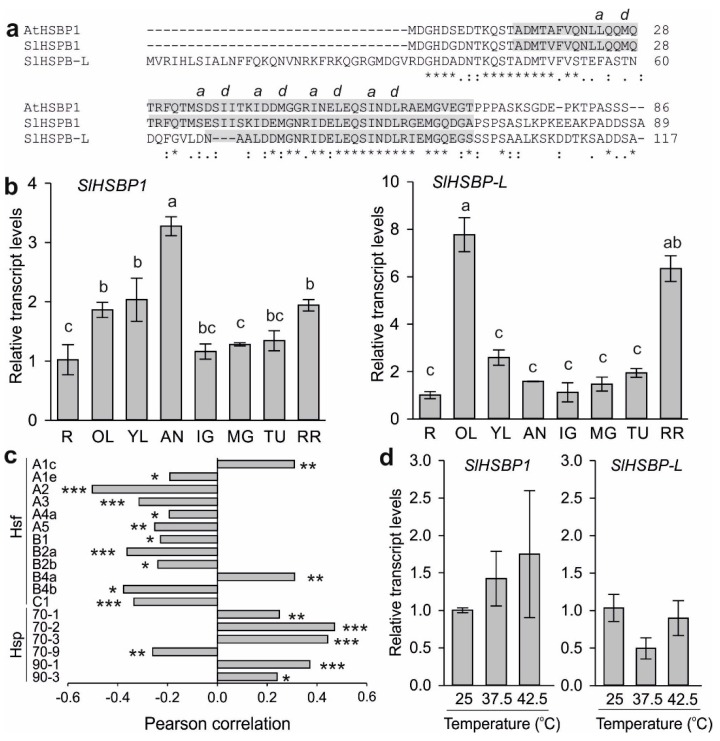
Figure 1.
Domain structure and expression analysis of tomato heat shock binding protein (HSBP) genes. (a) Amino acid sequence alignment of A. thaliana and tomato HSBP proteins by Clustal W. The coiled-coil region is depicted in grey background. Hydrophobic residues at the a and d positions are shown on top. (b) Transcript levels of tomato SlHSBP1 and SlHSBP-L in different organs. R: root; OL: old leaf; YL: young leaf; AN: anther; IG: immature green fruit; MG: mature green fruit; TU: turning fruit; RR: red ripe fruit. Analysis was done by qRT-PCR using EF1a as a housekeeping gene, and the transcript levels were normalized to the root sample. Values are the average of three replicates, and error bars indicate the standard deviation. Different letters denote significant differences (p < 0.05) based on ANOVA analysis and Duncan’s multiple range test. (c) Pearson correlation analysis of transcript levels of SlHSBP1 with heat shock transcription factors (Hsfs) and heat shock proteins (Hsps) in tomato organs and tissues. Transcript levels were obtained from the TOMEXPRESS database (n = 106). Asterisks indicate significance (* p < 0.05, ** p < 0.01 *** p < 0.001) (d) Transcript levels of SlHSBP1 and SlHSBP-L in young tomato leaves exposed to different temperatures for 1 hour. Values for panels b and d are the average of three biological replicates ± SD.

