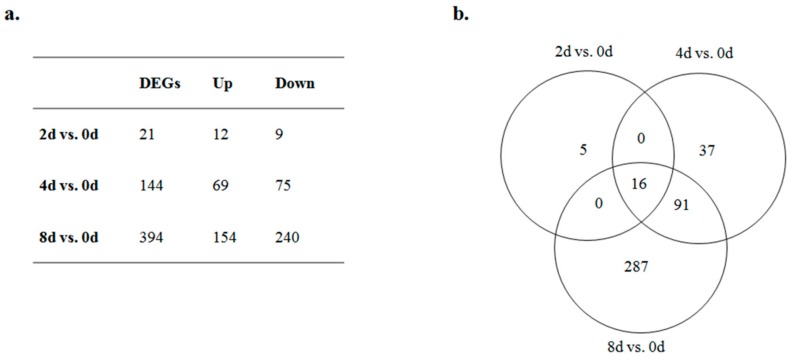
Figure 2.
Venn diagram and summary of differentially expressed genes (DEGs) at different stages. (a) Summary of DEGs at four stages. Up represents upregulation at days 2, 4, and 8 vs. day 0. Down represents downregulation at days 2, 4, and 8 vs. day 0. (b) Venn diagram of DEGs at three time-point comparisons.

