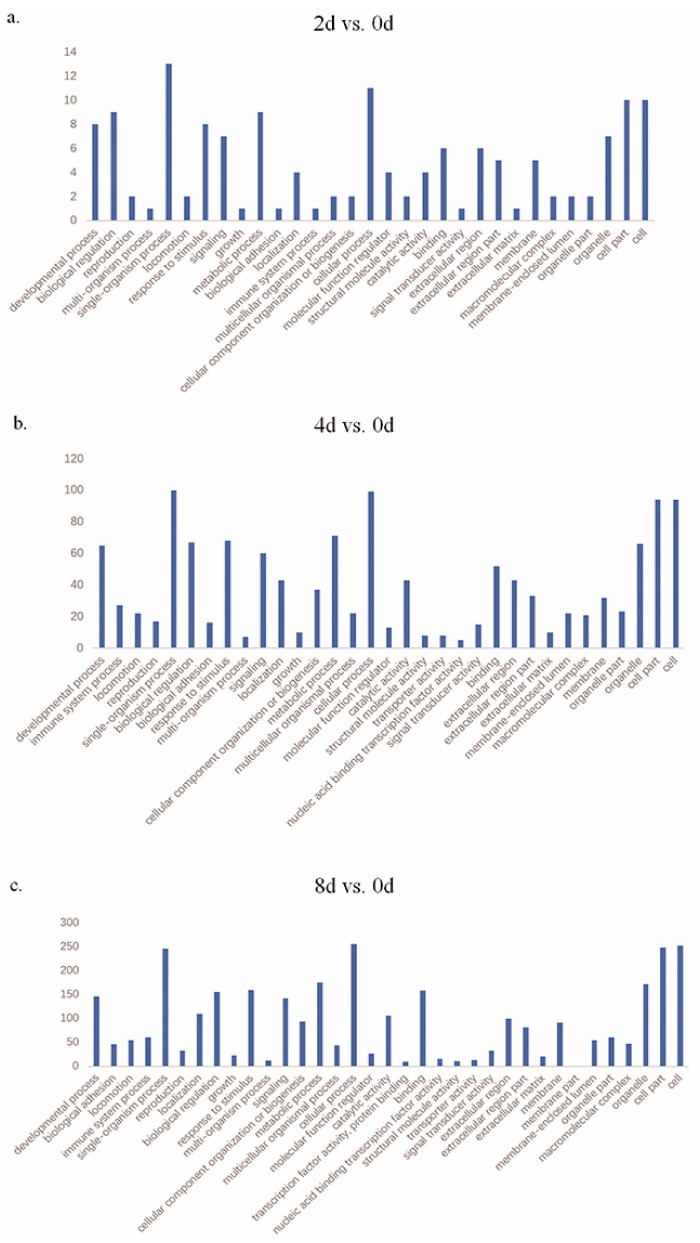
Figure 3.
Gene Ontology (GO) functional enrichment analysis of DEGs at different stages. (a) GO terms overrepresented among DEGs between days 2 and 0. (b) GO terms overrepresented among DEGs between days 4 and 0. (c) GO terms overrepresented among DEGs between days 8 and 0. The results are summarized in the following three main categories: biological process, molecular function, and cellular component. The x-axis indicates functional groups. The y-axis indicates number of genes.

