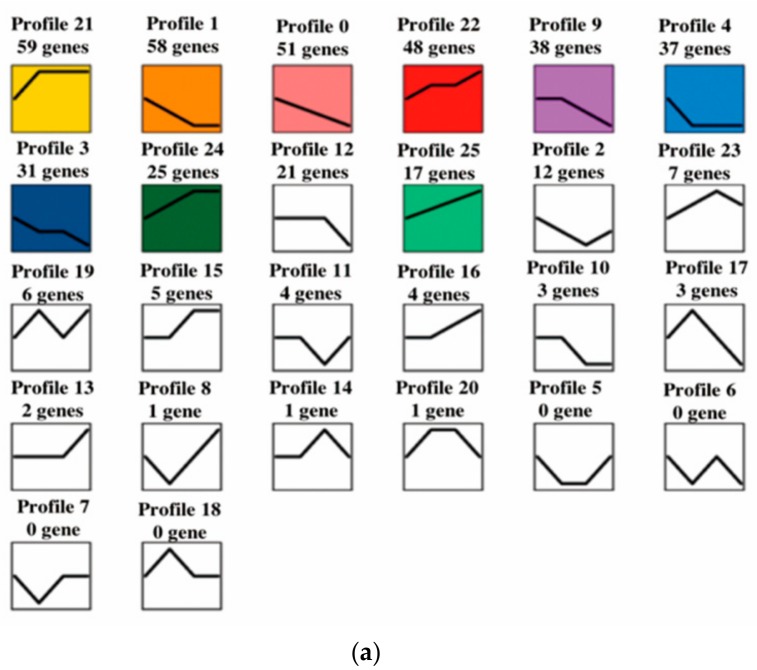
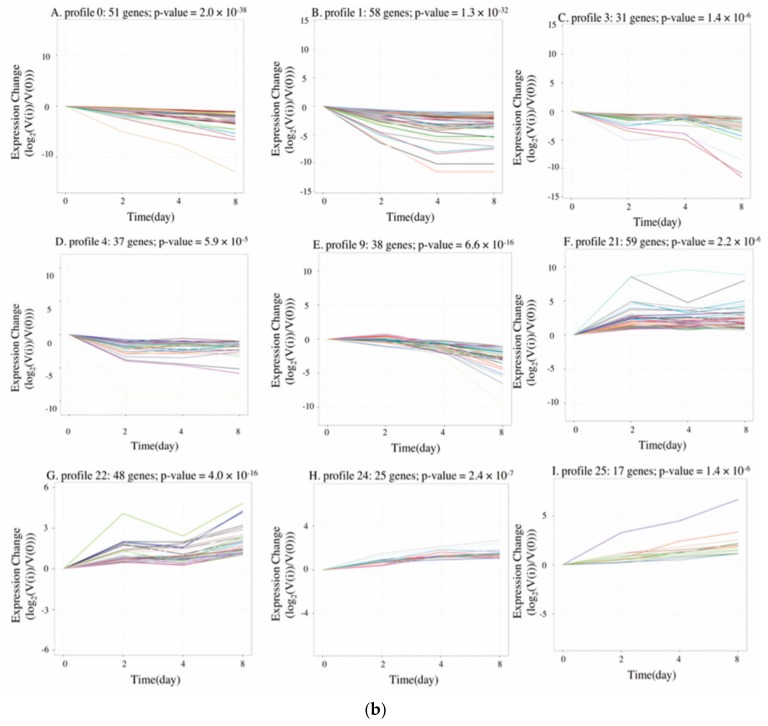
Figure 4.
Short time-series expression miner (STEM) clustering on DEGs during preadipocyte differentiation. (a) All 26 profiles, with the number of genes shown. Colored profiles were significant (p < 0.05). (b) Nine significant gene expression profiles. Significant gene expression profiles resulting from c = 2 and m = 50 (c indicates maximum unit change in model profiles between time points; m indicates maximum number of model profiles) are displayed as time-course plots of log2 gene expression ratios on days 2, 4, or 8 vs. day 0. The number of genes and the p-value in each profile are shown. Time is shown in days.


