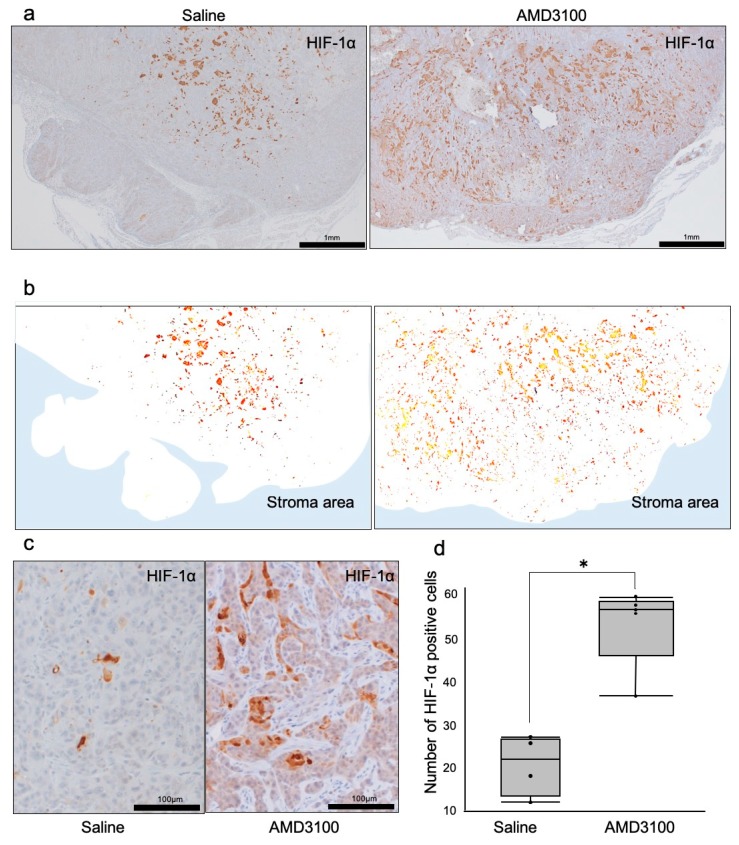
Figure 5.
Distribution of hypoxia-inducible factor-1α (HIF-1α) in tumors treated with or without CXCR4 antagonist AMD3100. (a) IHC for HIF-1α in the tumor area under low-power magnification. (b) Illustration of HIF-1α distribution in tumors. White area, tumor. Blue area, stroma. (c) IHC of HIF-1α under high-power magnification. (d) The number of HIF-1α-positive tumor cells. * p = 0.02, N = 5 mice.

