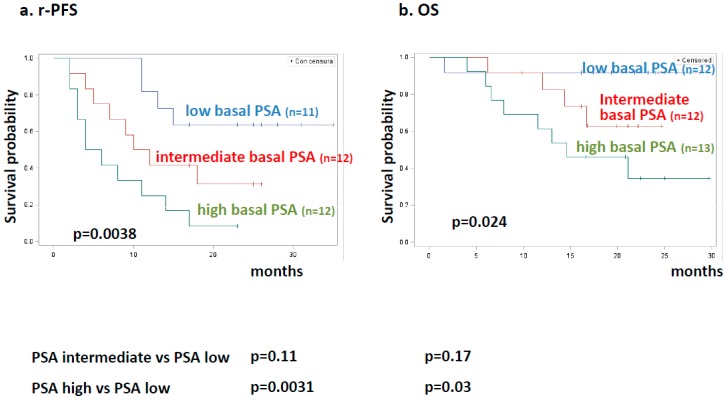
Figure 5.
Kaplan–Meier estimates for clinical outcome in patients stratified by basal PSA levels. (a) Radiologic progression-free survival (rPFS) in patients stratified for basal PSA levels by tertiles. Blue, red, and green lines represent 11 patients with low, 12 intermediate, and 12 high basal PSA levels, respectively. (b) Overall survival (OS) in patients stratified for basal PSA levels by tertiles. Blue, red, and green lines represent 12 patients with low, 12 intermediate, and 13 high basal PSA levels, respectively.

