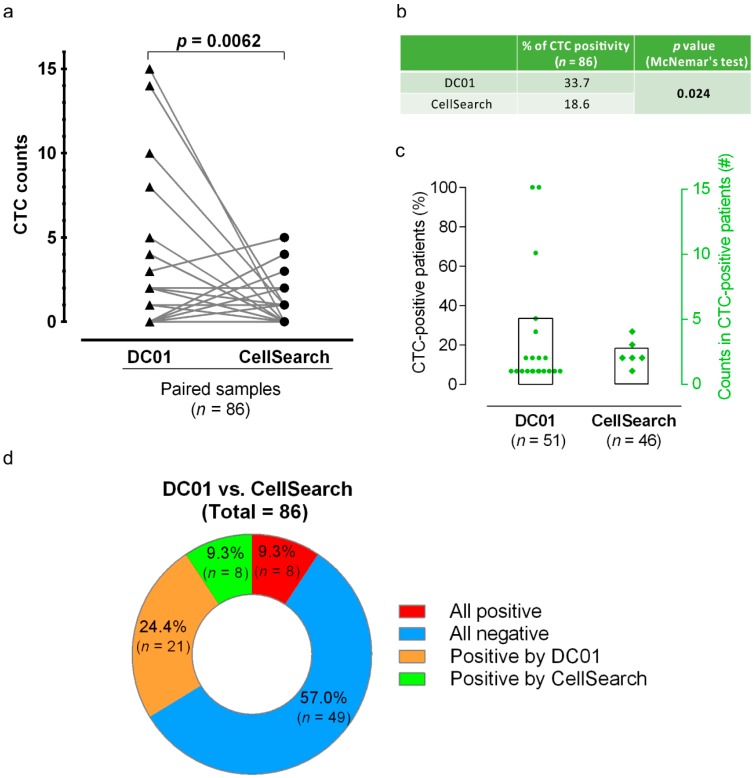
Figure 5.
Comparison of circulating tumor cell (CTC) positivity and CTC counts examined by the two CTC detection methods. (a) Comparison of CTC numbers by parallel analysis of patient samples using DC01 and CellSearch. The plot links the number of CTCs detected by means of parallel enumeration using DC01 and CellSearch. DC01 detected significantly higher numbers of CTCs than CellSearch (Wilcoxon matched-pairs signed-rank test, two-tailed, p = 0.0062). (b) Comparison of CTC positivity of both methods (p < 0.05 statistically significant, McNemar’s test). (c) Percentage of CTC-positive patients (bars, 33.7% and 18.6%) and number of CTCs detected per patient (dots, squares) listed for the parallel analysis in 51 patients using DC01 and CellSearch, respectively. (d) Concordance between the two CTC detection methods. Assays were not concordant if CTC status of one sample was differently detected by each method, meaning one assay was positive and the other negative (orange/green). Assays were assumed as concordant when CTC status was the same for one sample detected by both techniques (all positive <red> or all negative <blue>).

