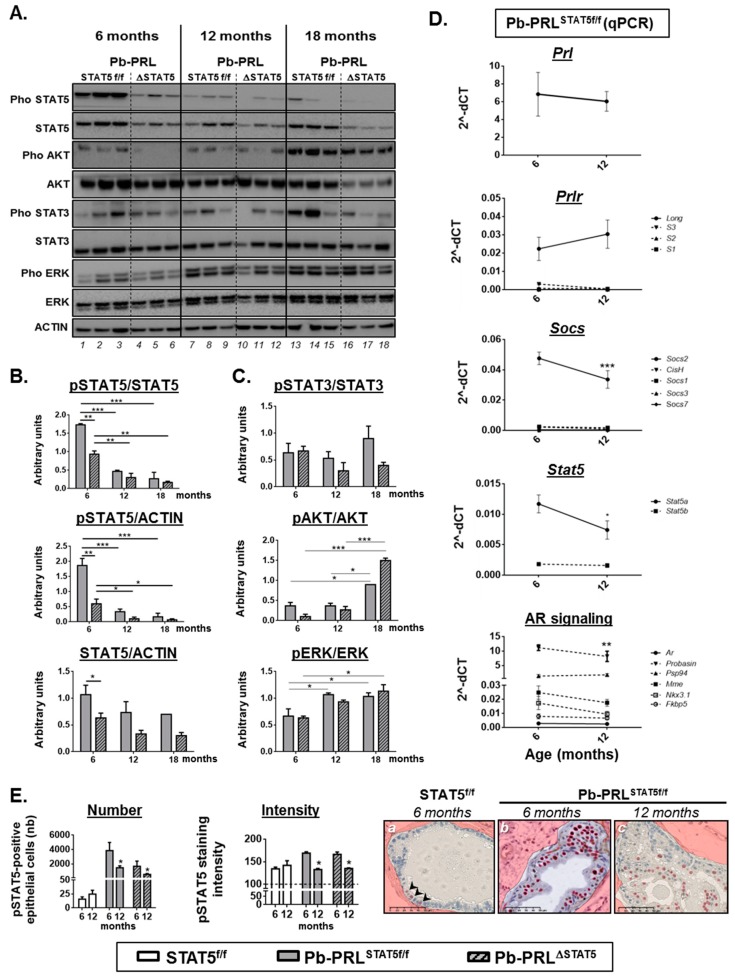
Figure 6.
Spontaneous STAT5 signaling shutdown and emergence of AKT and ERK1/2 signaling in aged Pb-PRL mice. (A). Canonical PRLR signaling pathways activated in dorsal prostates of Pb-PRLSTAT5f/f (lanes 1–3, 7–9, 13–15) and Pb-PRLΔSTAT5 (lanes 4–6, 10–12, 16–18) mice were compared at 6, 12 and 18 months of age as indicated. (B). Quantifications of the STAT5 pathway regarding STAT5 activation (pSTAT5/STAT5 ratio), tissue content in activated (pSTAT5/ACTIN) and total (STAT5/ACTIN) STAT5 as determined in panel A. (C). The activation of STAT3, AKT and ERK1/2 pathways as shown in panel A was quantified by densitometry as the ratio of phosphorylated versus total protein. (D). Age-dependent expression of various actors of the PRLR and AR pathways as determined by RT-qPCR in 6 and 12 month-old Pb-PRLSTAT5f/f mice. The dotted line represents low expressed genes of the PRLR pathway (upper panels) and target genes of the AR pathway (bottom panel). See Figure S6 for genotype-dependent expression in 12 month-old mice. (E). Comparison of the number of pSTAT5-positive cells and of the intensity of pSTAT5 immunostaining (the horizontal dotted line is the background threshold) in 6 versus 12 month-old STAT5f/f, Pb-PRLSTAT5f/f and Pb-PRLΔSTAT5 mice. Representative images of low number (arrows)/low intensity (STAT5f/f mice), high number/high intensity (6 month-old Pb-PRLSTAT5f/f), and high number/low intensity (12 month-old Pb-PRLSTAT5f/f) are shown (positive cells are red circled). Statistics: Stars denote significant differences in a repeated-measures two-way ANOVA with Sidak’s multiple comparisons. Size bars: 50 µm.

