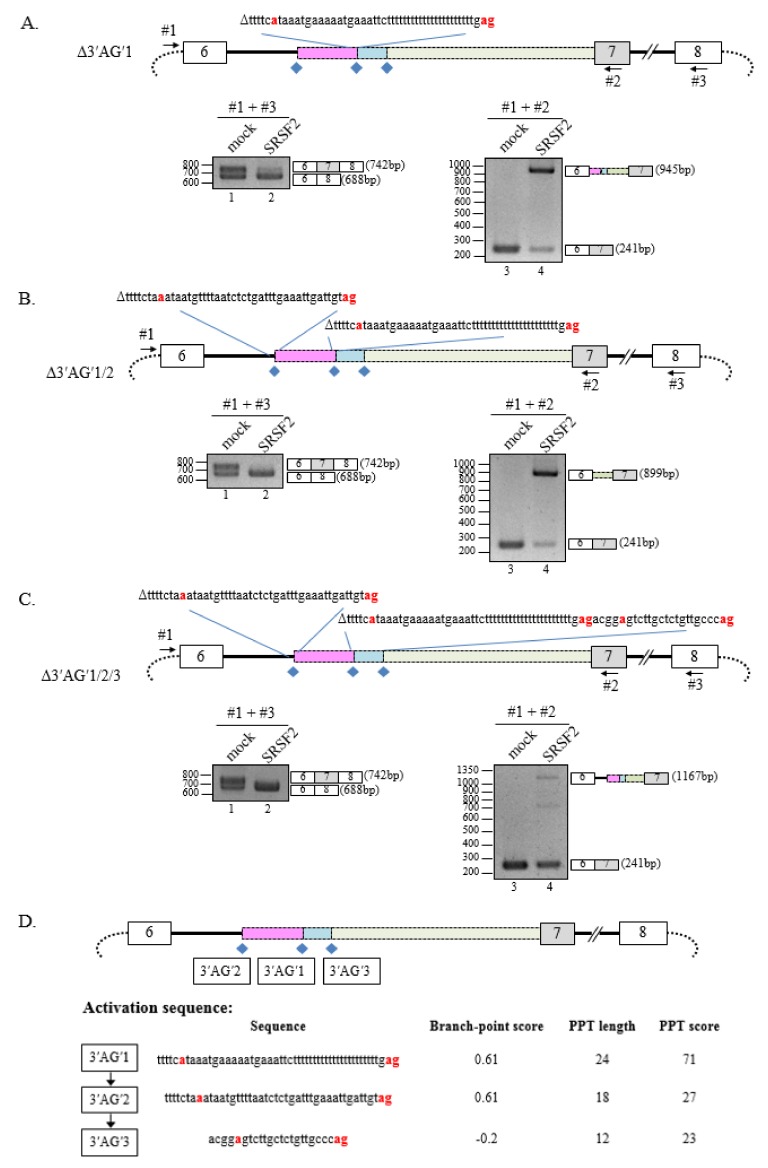
Figure 2.
Deletion of 3′AG′1 region induces SRSF2-dependent usage of alternate 3′AG′. (A) (Upper panel) Schematic diagram of the Δ3′AG′1 minigene. The nucleotide deletion is indicated at top but is otherwise the same as Figure 1A. (Lower panel) RT-PCR analysis of the Δ3′AG′1 minigene using RNA extracted from pcDNA- or SRSF2-expressing cells with primer pairs #1 and #3 (left) or #1 and #2 (right). (B) (Upper panel) Schematic diagram of the Δ3′AG′1/2 minigene. Both nucleotide deletions are indicated at top but is otherwise the same as Figure 1A. (Lower panel) RT-PCR analysis of the Δ3′AG′1/2 minigene using RNA extracted from pcDNA- or SRSF2-expressing cells with primer pairs #1 and #3 (left) or #1 and #2 (right). (C) (Upper panel) Schematic diagram of the Δ3′AG′1/2/3 minigene. Nucleotide deletions encompassing all three cryptic splice-sites are indicated at top but is otherwise the same as in Figure 1A. (Lower panel) RT-PCR analysis of the Δ3′AG′1/2/3 minigene using primers #1 and #3 (left) or #1 and #2 (right). (D) Summary of the order of activation (splice-site usage) of the various cryptic splice-sites based on BP score and PPT strength.

