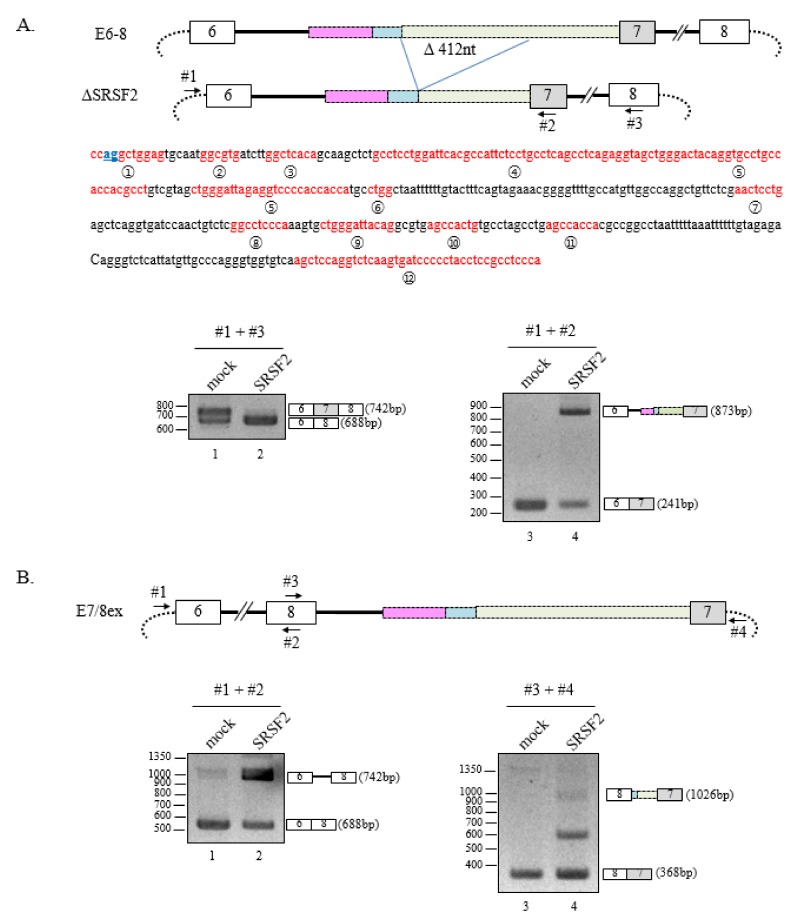
Figure 3.
Multi SRSF2-binding sequences and clusters are responsible for 3′AG′ activation by SRSF2. (A) (Upper panel) Schematic diagram of the ΔSRSF2 minigene. The nucleotide deletion is indicated using blue lines. The primer binding sites used in lower panels are indicated with arrows. (Middle panel) The sequence of deleted 412 nt is shown. Potential SRSF2 binding sites and clusters are shown in red and numbered. (Lower panel) RT-PCR analysis of the ΔSRSF2 minigene in SRSF2-expressing cells using primers #1 and #3 (left) or #1 and #2 (right). (B) (Upper panel) Schematic diagram of the E7/8ex minigene where a portion including intron 6 though exon 7 was swapped with a region containing intron 7 through exon 8. The primer binding sites used in lower panels are indicated with arrows. (Lower panel) RT-PCR analysis of the E7/8ex minigene in SRSF2-expressing cells using primers #1 and #2 (left) or #3 and #4 (right).

