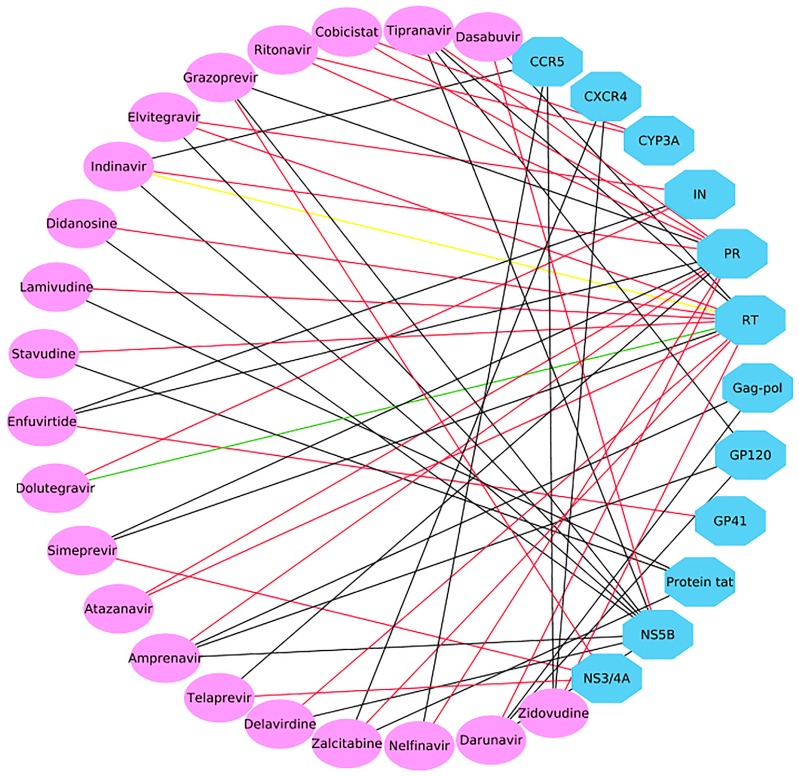
Figure 7.
Polypharmacological analysis of 17 approved HIV-1 drugs and four approved HCV drugs based on the 60 multiple QSAR models generated in this study. Ellipses and octagons represent drug nodes and protein nodes, respectively. A red line indicates that the chemical–protein interaction (CPI) was experimentally verified as active. A black line indicates that the interaction was not proven to be worthy of further experimental validation. A green or yellow line indicates that the interaction was experimentally validated as inactive or inconclusive, respectively.

