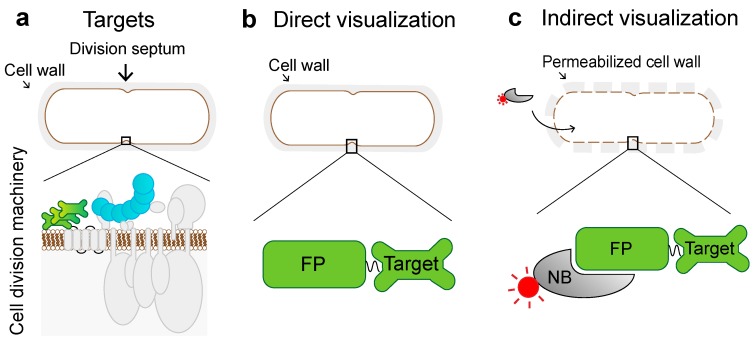
Figure 1.
Schematic diagram of the bacterial protein complex and methods for visualization. (a) Cartoon representation of the B. subtilis cell featuring cell wall (gray), cell membrane (brown), and cell division proteins forming the cell division machinery. Proteins FtsZ and DivIVA visualized in this study are highlighted in blue and green, respectively. (b) The signal from a fluorescent protein (FP) fused to the target protein is directly visualized or (c) the target is indirectly visualized by fluorescently (red) labeled nanobodies (NB).

