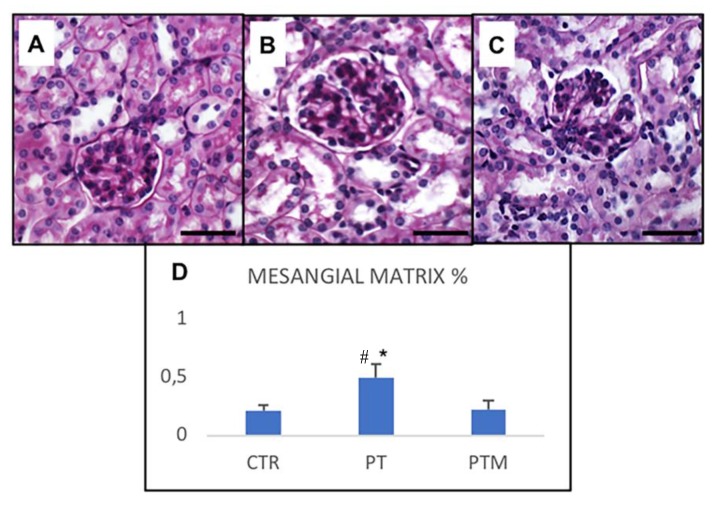
Figure 1.
Intraglomerular mesangial matrix and proximal tubules brush border. Photomicrographs showing glomeruli, proximal and distal tubules PAS staining of control mice (A), pristane-LN mice (B), pristane-LN mice treated with melatonin (C). Bar equals 20 μm. The graph (D) summarizes the morphometrical analysis of intraglomerular mesangial matrix PAS-positive staining. * # indicate respectively statistically significant differences vs. control and pristane-LN mice treated with melatonin: p < 0.05. CTR: control mice PT: pristane-LN mice PTM: pristane-LN mice treated with melatonin.

