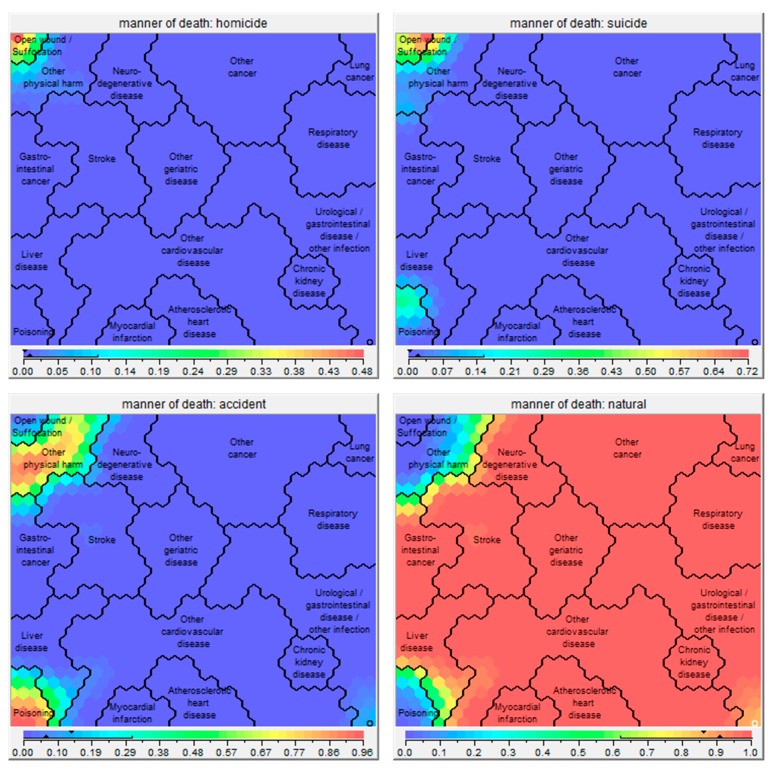
Figure 4.
Self-organizing maps showing the manner of death (homicide, suicide, accident, natural death) of the 16 clusters. Red parts of the map consist of high percentages of persons dying in the indicated manner, whereas blue parts consist of low percentages of persons dying in the indicated manner. The exact percentages are given in the bar under the respective map picture.

