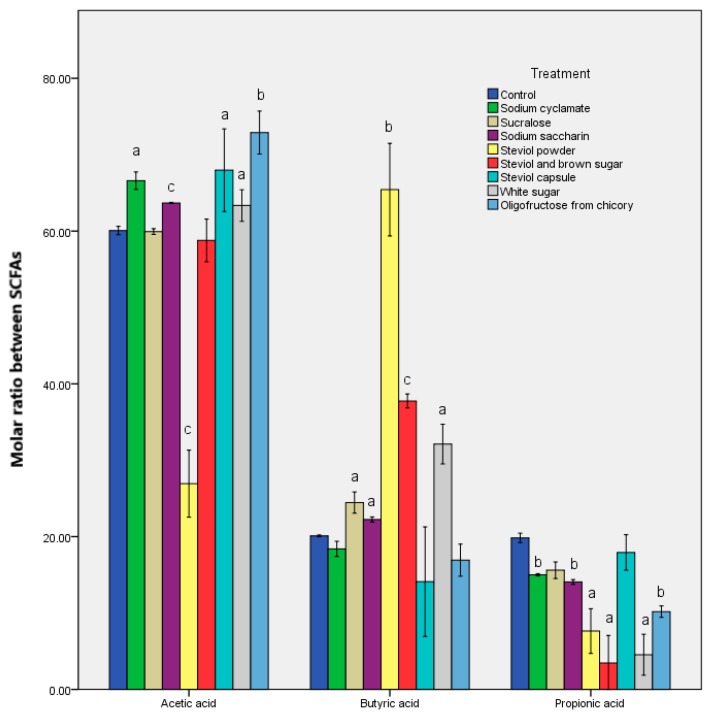
Figure 2.
Molar ratio between the acetic, propionic, and butyric acids obtained after the in vitro tests through GIS1 as a measure of the impact of the sweeteners consumed on the metabolic activity of the microbiota. Different letters indicate significant statistical differences (a: p ≤ 0.05; b: p ≤ 0.01; c: p ≤ 0.001), n = 3.

