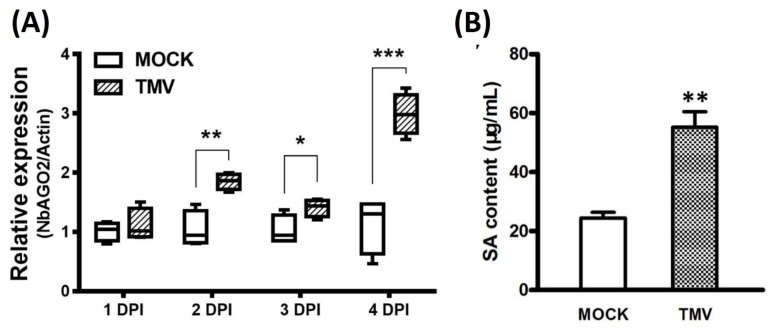
Figure 5.
TMV infection elevated NbAGO2 expression and endogenous SA level. (A) Three-leaf stage N. benthamiana was infected with TMV, and the leaves were collected at different DPI. NbAGO2 expression was determined by quantitative real-time PCR. Plants inoculated with inoculation buffer containing empty vector expression GV3101 served as control treatment. NbAGO2 expression in control was arbitrarily designated as 1. NbActin gene served as the internal control. (B) Three-leaf stage N. benthamiana was infected with TMV, and the leaves were collected 5 h post infection. SA level was determined by UV Vis Spectrophotometry at 310 nm. Significant differences between mock and infected groups were calculated by Student’s t-test. Single, double, and three asterisks indicated significant difference at p < 0.05, p < 0.01, and p < 0.001, respectively.

