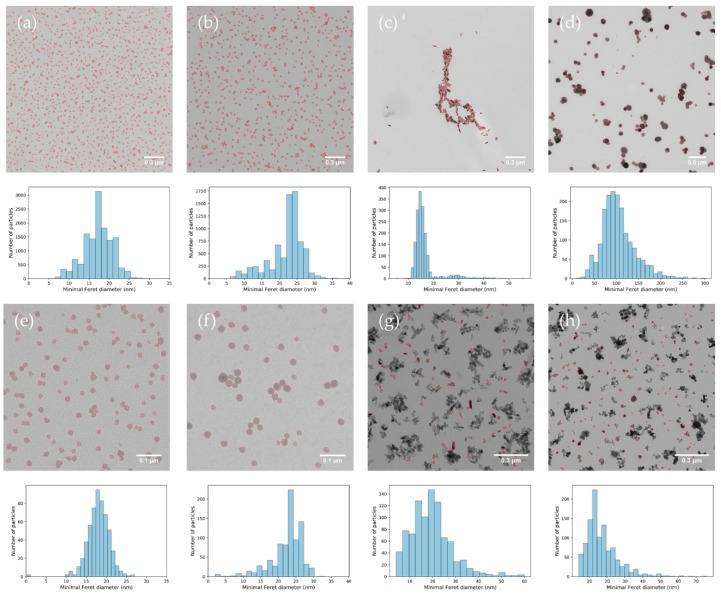
Figure 3.
Annotated transmission electron microscopy (TEM) images analysed by the ParticleSizer software and corresponding particle size distributions (of 1 set of 10 images) for (a) ERM-FD100 18,500×, (b) ERM-FD304 18,500×, (c) Gold nanorods, (d) NM-100, (e) ERM-FD100 68,000×, (f) ERM-FD304 68,000×, (g) NM-103, and (h) NM-212.

