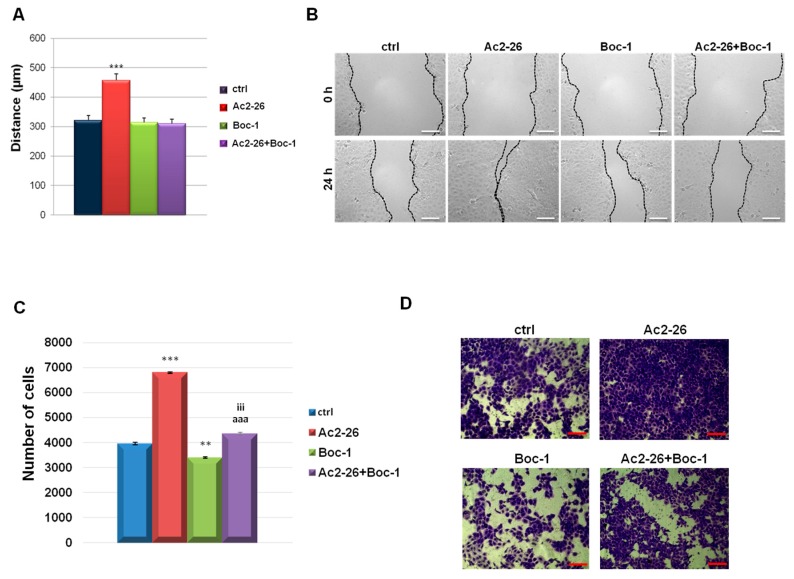
Figure 4.
(A) Analysis of the migration rate in the presence or not of Ac2-26 (1 µM) and Boc-1 (100 µM). The migration rate was determined by measuring the wound closure by individual cells from the initial time (0 h) to the selected time-points (24 h) (bar of distance tool, Leica ASF software). Representative images for migration assay are reported in (B). Bar = 150 µm. (C) Analysis of invasion speed of keratinocytes treated or not with Ac2-26 (1 µM) and Boc-1 (100 µM). Data represent the mean cell counts of 10 separate fields per well. The data represent a mean of three independent experiments ± SEM, their statistical significance were evaluated using Student’s t-test, assuming a 2-tailed distribution and unequal variance. ** p < 0.01; *** p < 0.001 for treated vs. non treated cells; aaa p < 0.001 for Ac2-26+Boc-1 vs. Ac2-26; iii p < 0.001 for Ac2-26+Boc-1 vs. Boc-1. (D) Representative images of analysed fields of invasion assay on keratinocytes. Magnification 20×. Bar = 50 μm.

