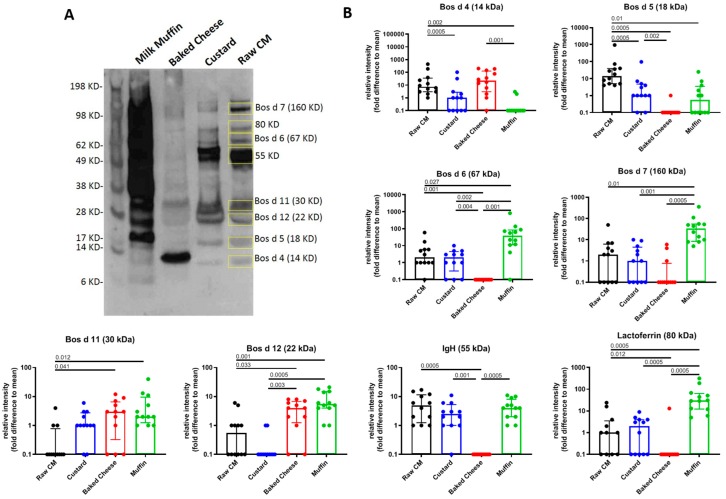
Figure 3.
Quantification of IgE reactivity of allergen-corresponding protein bands in raw, pasteurized CM, custard, baked cheese and muffin extracts. (A) Representative western blot using an individual plasma sample, showing IgE-reactive protein bands. Bands that were quantified are shown in the raw, pasteurized CM extract lane, indicated by yellow boxes. Molecular weight markers (KD) are shown in the left side. (B) Bar graphs showing quantification of the eight protein bands (relative band intensities expressed as fold difference to mean) in the four extracts from western blots of individual subjects. Bars represent median, with error bars showing interquartile range, (n = 12).

