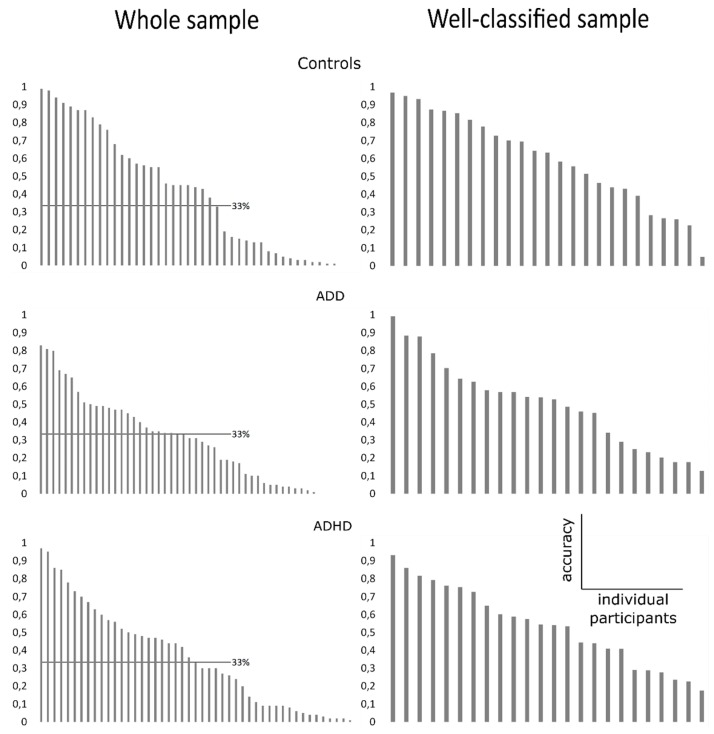
Figure 1.
Plots showing distribution of classification accuracy in the whole sample (A) and in the well-classified sample (B) for all three groups. Y-axis indicates classification accuracy, x-axis indicates the individual participants ranked by classification accuracy (from highest to lowest). In (A), the single-trial EEG data recorded during the time estimation was used to classify each individual participant as belonging to the healthy control, the Attention Deficit Disorder (ADD), or the Attention Deficit Hyperactivity Disorder (ADHD) group. To account for potential artifacts and outliers, any participants with a classification accuracy below chance level (33%, as indicated by vertical line) were not included in subsequent analyses. In (B), the same analysis of classification accuracy was run a second time. Here, only the single-trial EEG data of participants belonging to the well-classified sample were used. Importantly, the plots show the distribution of classification accuracy.

