Figure 4.
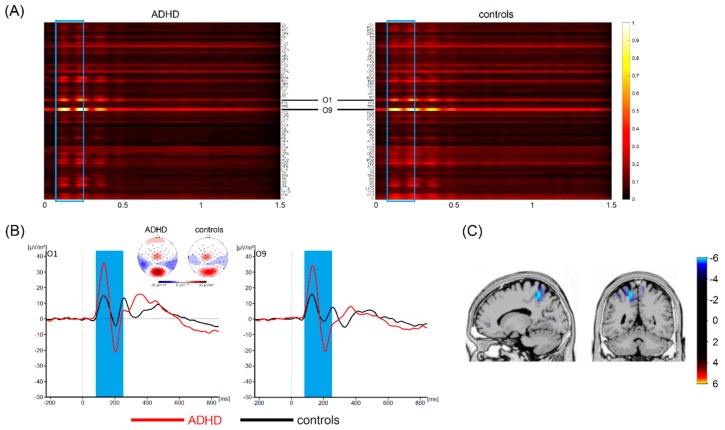
(A) Visualization maps showing the relevance of all time points and electrodes for classification between patients with ADHD and healthy controls. Values close to 1 indicate that the specific feature at the specific time points contributes most to the classification accuracy. The blue frame highlights the most important time range. Based on visual inspection, electrodes O1 and O9 carried the highest relevance. (B) Corresponding waveforms (event-related potentials) at the most relevant electrodes are shown with the relevant time range according to the applied machine learning algorithm highlighted in blue. Time point zero denotes stimulus onset in the interval timing task. The black line denotes healthy controls, the red line denotes patients with ADD. Topographic maps show cortical activity in the highlighted time ranges. Blue values denote negativities, red values show positive activations. (C) Results of sLORETA source localization show for activation in superior parietal areas to be different between healthy controls and patients with ADHD in the relevant time range.

