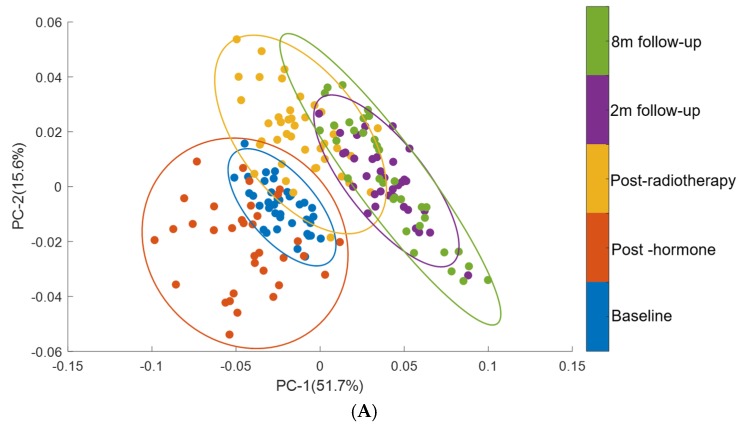
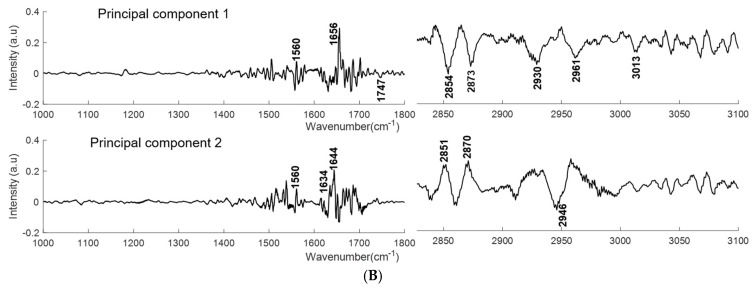
Figure 4.
PCA of plasma spectra from patients from baseline through therapy and up to eight months follow up. (A) Score plots are shown for patients at baseline (blue), post hormone (red), post radiotherapy (yellow), two months follow up (purple) and eight months follow up (green) (B) PC-1 and PC-2 loading plots for regions 1000–1800 cm−1 and 2800–3100 cm−1. Covariance ellipses (95% confidence) are shown for each class.


