Figure 4.
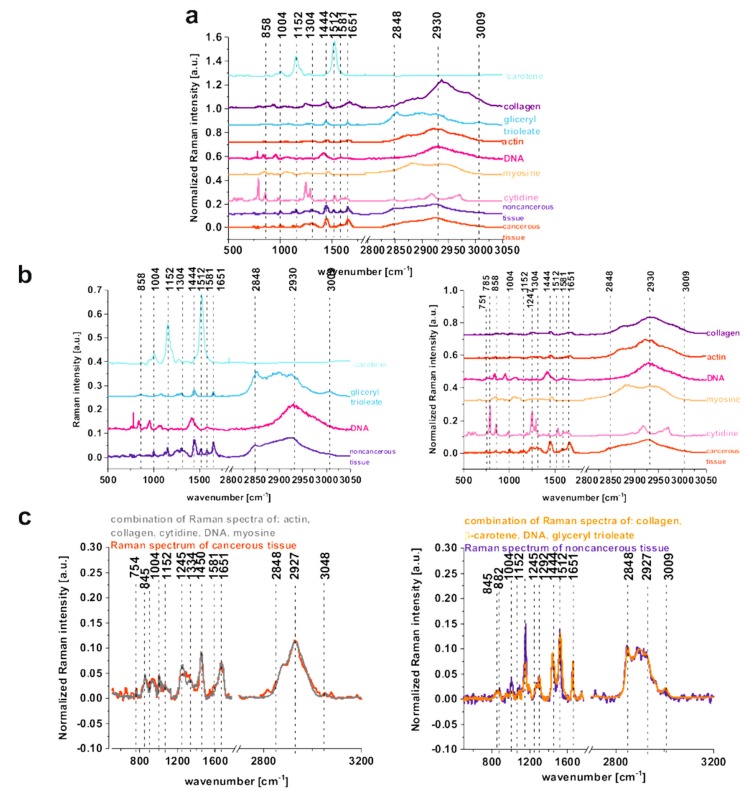
The comparison of the mean Raman spectra of the noncancerous and the cancerous tissues of the human colon (average spectra calculated based on 36,500 single spectra) and Raman spectra of DNA, lipids: glyceryl trioleate, proteins including structural proteins: collagen, actin, myosin, nucleoside molecule: cytidine, and natural antioxidants: beta-carotene (a), the comparison of the mean Raman spectra of the noncancerous human colon tissue with beta-carotene, glyceryl trioleate, DNA and the comparison of the mean Raman spectra of the cancerous human colon tissue with collagen, actin, DNA, myosin, cytidine (b) the comparison of the Raman spectra of the noncancerous and the cancerous human colon tissue with the combination of Raman spectra calculated based on pure components for the noncancerous and the cancerous human colon tissue (the combination of Raman spectra of pure components was performed using WITec Project Plus) (c).

