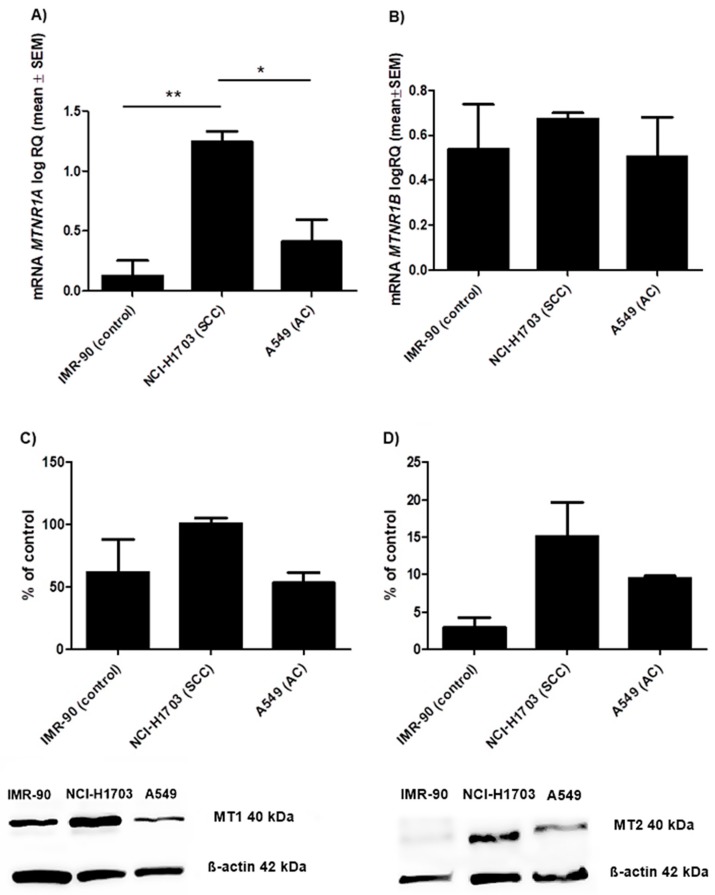
Figure 5.
Expression level of melatonin receptors in lung cancer cell lines that represents different histology subtypes: NCI-H1703 (squamous cell carcinoma, SCC), A549 (adenocarcinama, AC) and IMR-90 (control). Relative quantification (RQ) mRNA expression levels of (A) MTNR1A mRNA (* p < 0.05; ** p < 0.01; Bonferroni Multiple Comparison test) and (B) MTNR1B mRNA. Western blot illustrates the presence of melatonin receptors (C) MT1 and (D) MT2 in the studied cell lines. Densitometric analysis of the bands demonstrates differences in MT1 and MT2 protein contents between the selected cell lines. All the experiments were performed in triplicates.

