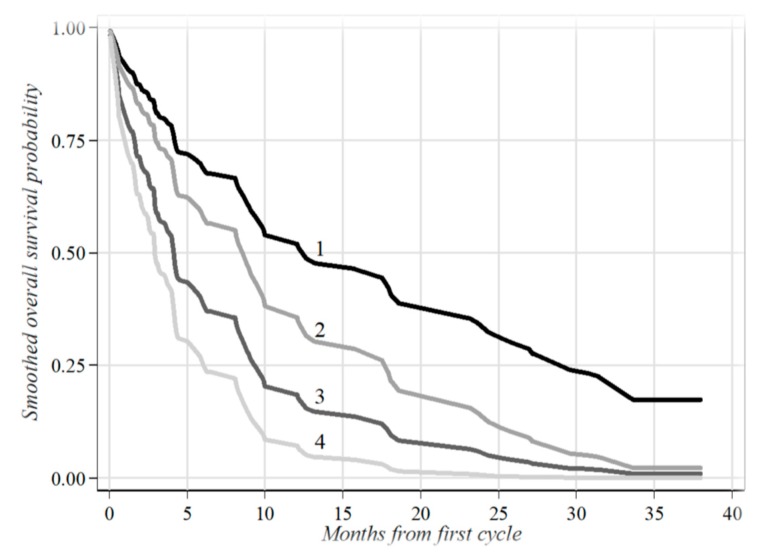
Figure 2.
Survival probabilities estimated through the Cox regression modeling in four risk subgroups. The risk subgroups were identified by cross-classifying patients according to the two categories of both biomarkers evaluated at baseline (CTCs: ≤ 2 and > 2; cfDNA: ≤ 836.5 and > 836.5) considered as time-dependent covariates (p < 0.001). 1—CTCs ≤ 2 and cfDNA ≤ 863.5, HR = 1.00 (Reference category): 27 patients; 2—CTCs > 2 and cfDNA ≤ 863.5, HR = 1.72 (95% CI = 0.98-3.02): 17 patients; 3—CTCs ≤ 2 and cfDNA > 863.5, HR = 2.64 (95% CI = 1.44–4.83): 21 patients; 4—CTCs > 2 and cfDNA > 863.5, HR = 4.53 (95% CI = 2.11–9.73): 24 patients; HR: hazard ratio; 95% CI: 95% confidence intervals for HR. p-value: probability level associated with the likelihood ratio test. Ref.: reference category.

