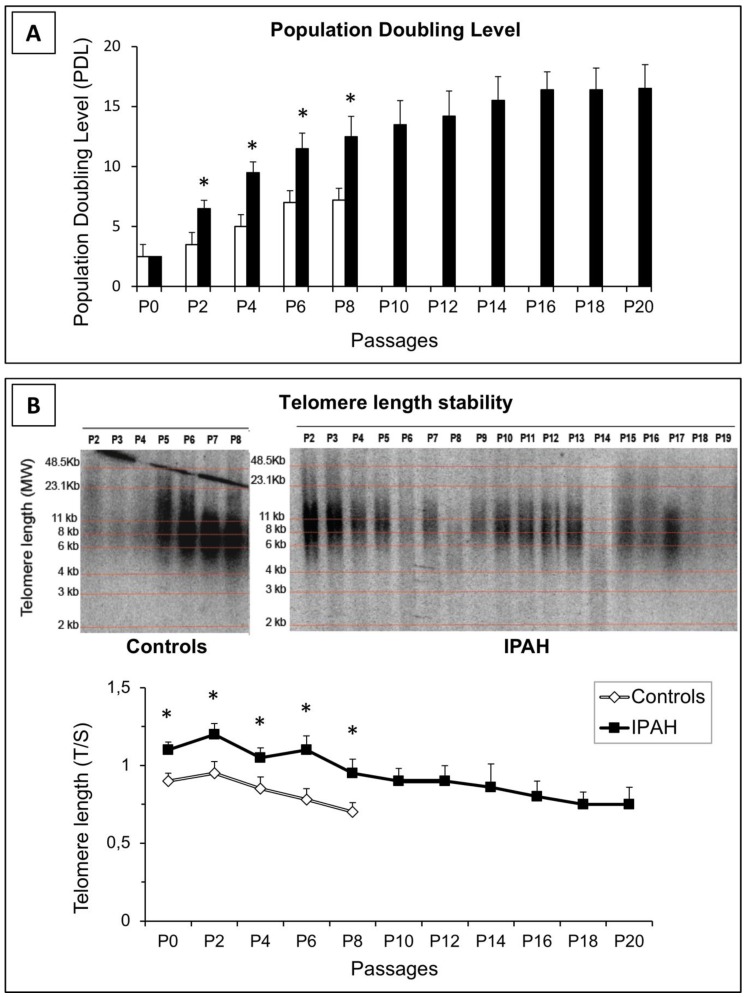
Figure 2.
Growth capacity of PASMCs. (A) Population doubling level (PDL) was calculated at each passage by cell counting. In contrast to control cells, IPAH-PASMCs continued proliferating for many more passages. * p < 0.01. (B) Changes in telomere length in control and IPAH-PASMCs with advancing population doubling in vitro, as illustrated by Southern blotting (representative image) and qPCR (bottom panel). * p < 0.01 between controls and IPAH.

