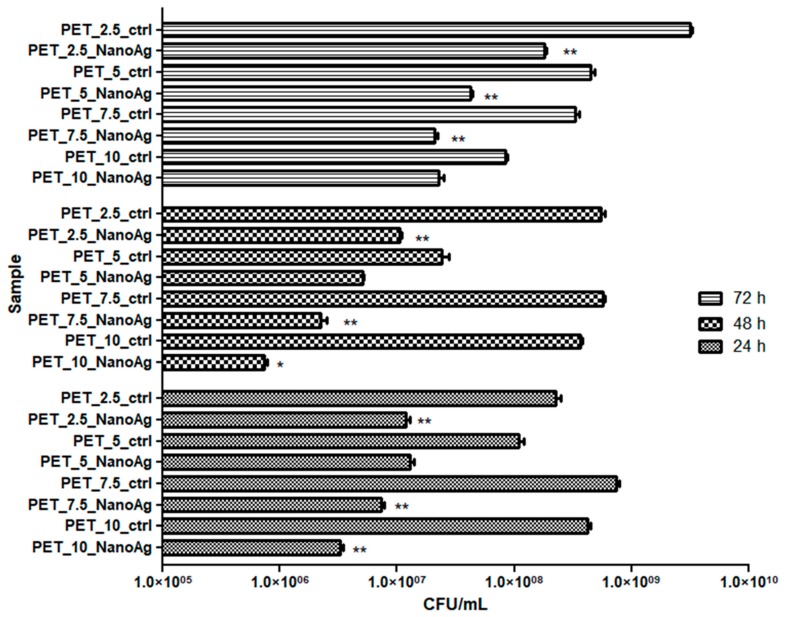
Figure 9.
Graphic representation of CFU/mL, representing the number of P. aeruginosa viable cells included in the monospecific biofilms developed on the surface of the materials, quantified after 24 h, 48 h, and 72 h at 37 °C. * p ≤ 0.001, ** p ≤ 0.05 comparing control PET and NanoAg PET obtained at the same flow rate.

