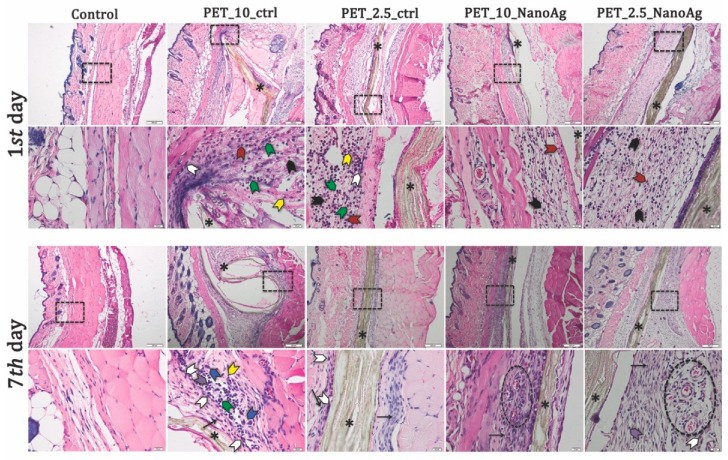
Figure 13.
Representative histological images of PET_X_NanoAg mats-implanted sites in mice—days one and seven post-implantation. Neutrophils (black arrowhead); monocytes (green arrowhead); eosinophils (red arrowhead); macrophages (white arrowhead); plasma cells (purple arrowhead); giant cells (blue arrowhead); lymphocytes (yellow arrowhead); * implant (asterisk). Cells were stained with hematoxylin and eosin (H&E) stain. Scale bars = 200 and 20 μm.

