
Figure 5.
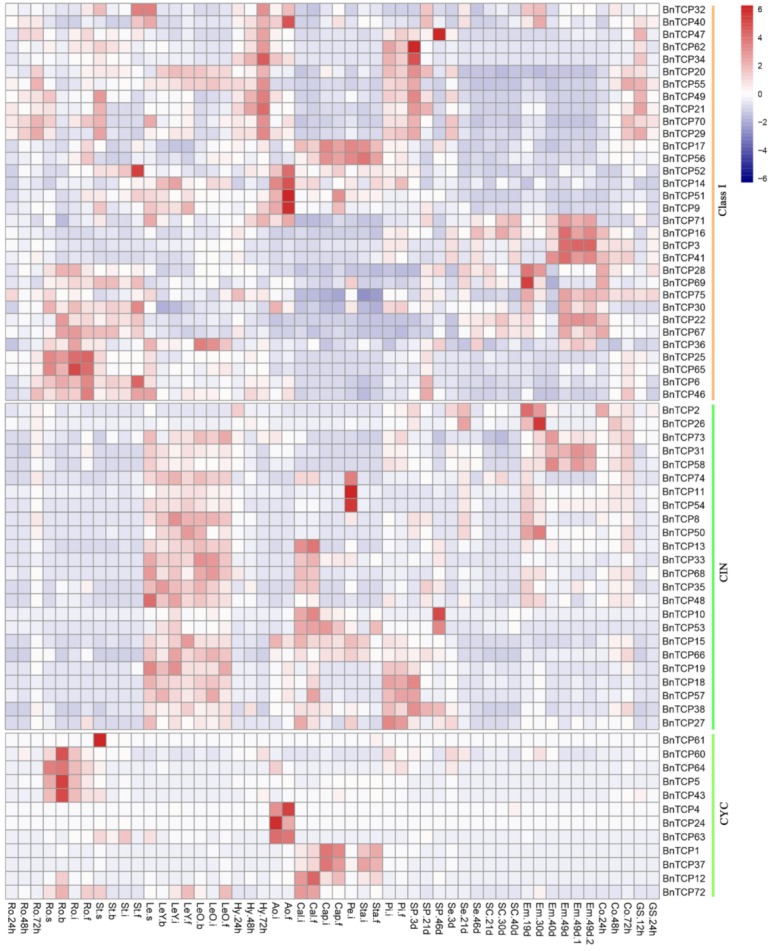
Expression profiles of TCP genes in Brassica napus across different developmental stages and organs. The heatmap was drawn using the R package [52]. Genes and their subgroups are shown on the right. Tissues used for expression analysis are indicated at the top of each column. Ro: root; St: stem; Le: leaf; Hy: hypocotyl; Ao: anthocaulus; Cal: calyx; Cap: capillament; Pe: petal; Sta: stamen; Pi: pistil; Sp: silique pericarp; Se: seed; Sc: seed coat; Em: embryo; Co: cotyledon; and GS: germinating seeds. D; days; H: hours. “-s”, “-b”, “-i”, and “-f” represent the “seedling”, “bud”, “initial flowering”, and “full bloom” stages of B. napus, respectively. Colored bars represent log2 expression values. Red, green, and black indicate high, low, and medium gene expression levels, respectively.