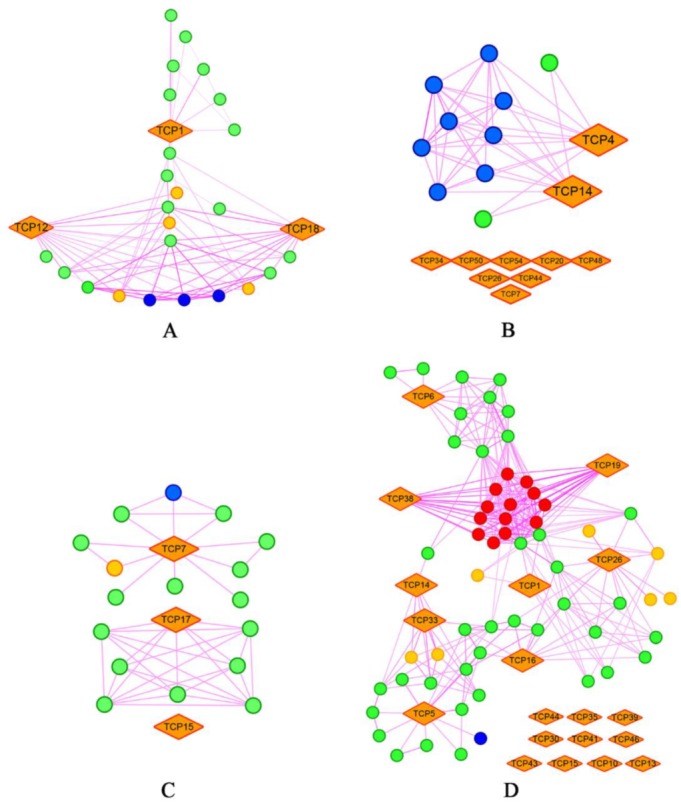
Figure 6.

Interaction network of TCP proteins within the CYC clade in (A) Arabidopsis thaliana, (B) Glycine max, (C) Oryza sativa, and (D) Zea mays according to the STRING dataset [55]. The interaction network was constructed in Cytoscape 3.6.1 [62]. CYC proteins are displayed as orange rhombs. Light orange circles represent other TCP proteins. Blue circles indicate proteins involved in the strigolactone pathway. Red circles represent the Hsp70 domain-containing proteins.
