Figure 1.
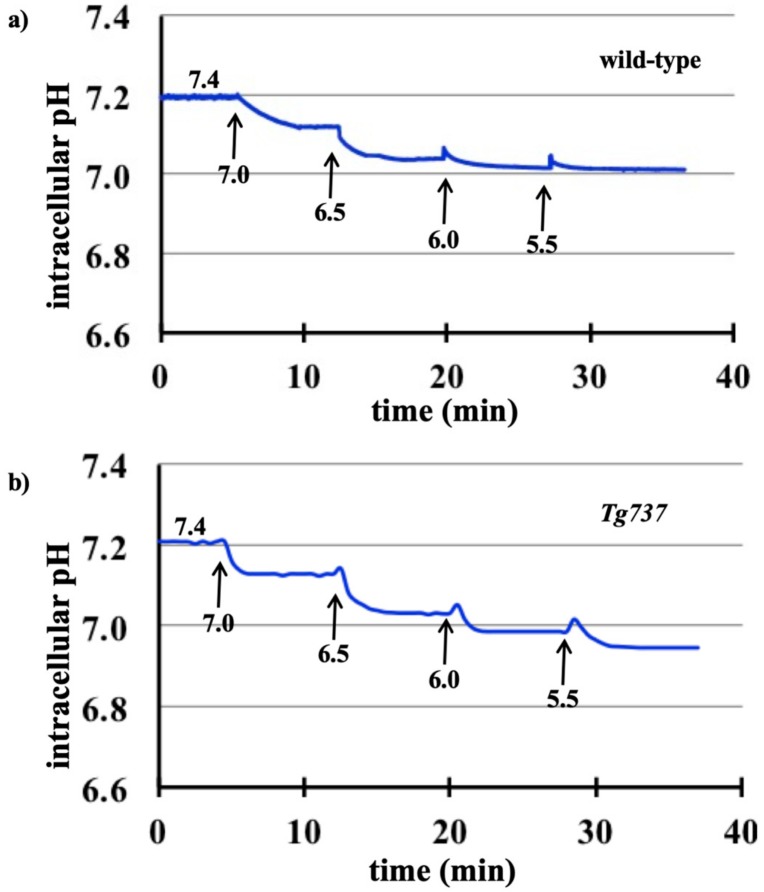
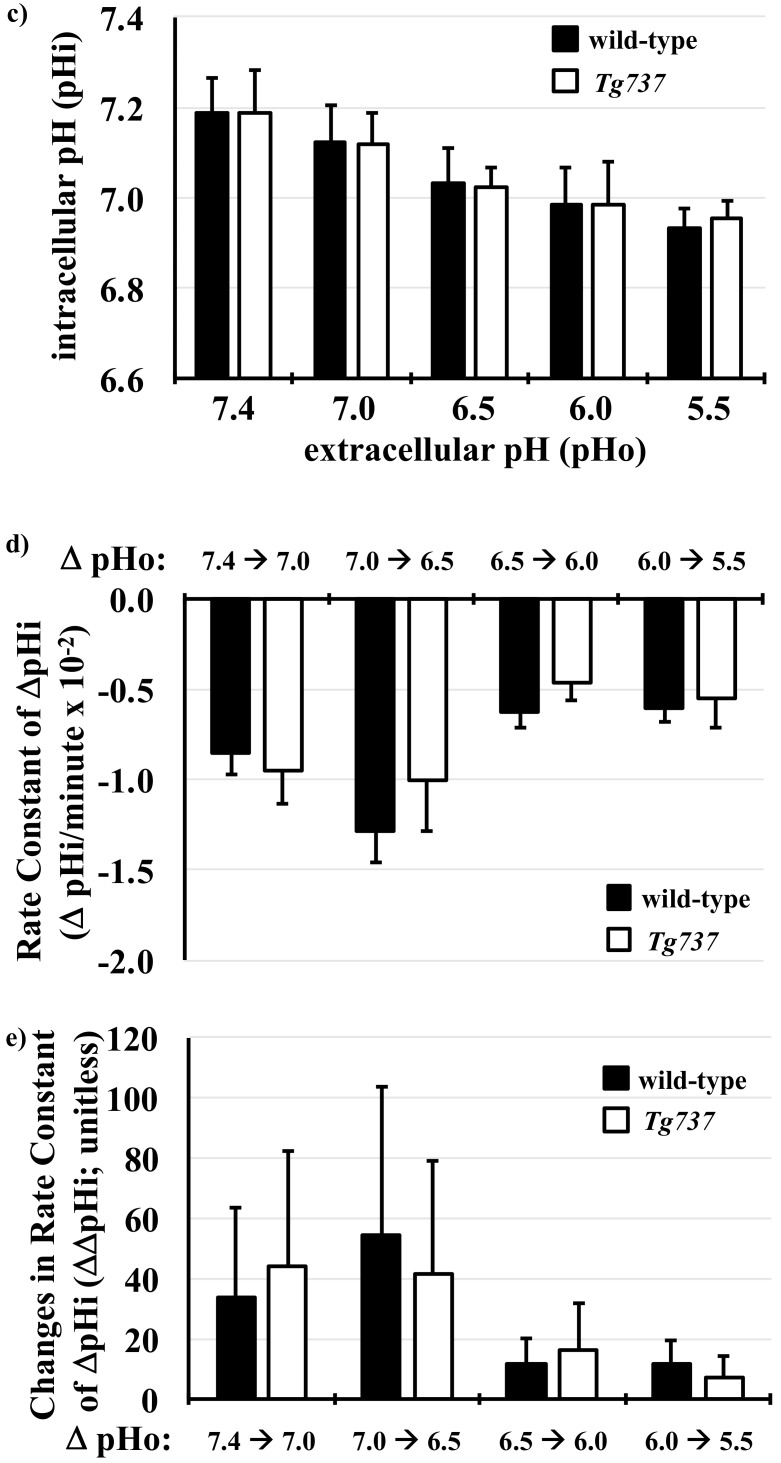
Decreased intracellular pH in response to acidic extracellular pH in wild-type and Tg737 cells. (a,b) Representative tracings of changes in intracellular pHi when wild-type and Tg737 cells are exposed to media of decreasing extracellular pH (pHo) from 7.4 to 5.5. (c) As the pHo is decreased, both cell lines show a similar decrease in their pHi. (d) The rate constant pHi changes (ΔpHi) in response step changes in pHo are also similar in both cell lines. A negative value indicates a decrease in pHi. (e) Changes in ΔpHi (ΔΔpHi) are normalized to identify variability within ΔpHi in response to step changes in pHo. No variation is observed if there is no acceleration or deceleration (first order kinetic or ΔΔpHi = 0). Highest variation (ΔΔpHi = 100) indicates that an alternate acceleration-deceleration pattern occurred (if acceleration = deceleration, then ΔpHi = 0).


