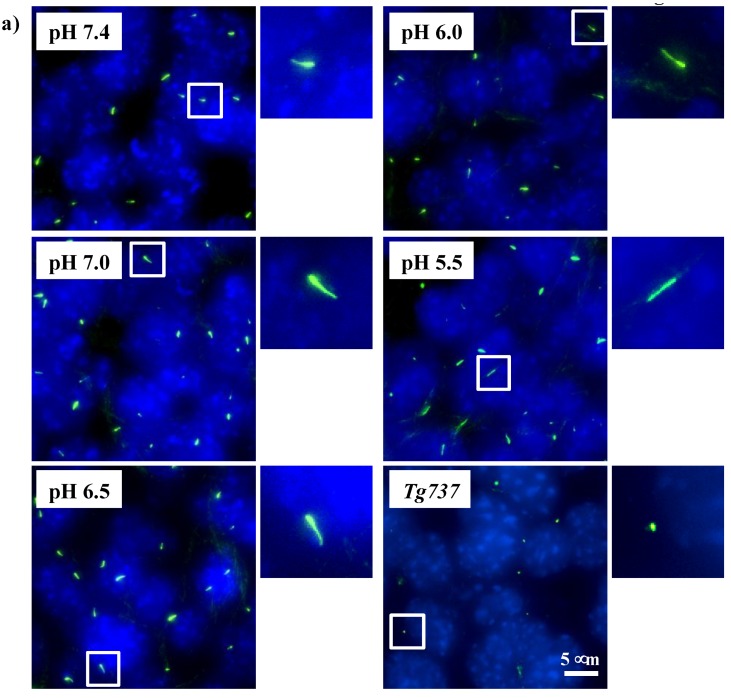
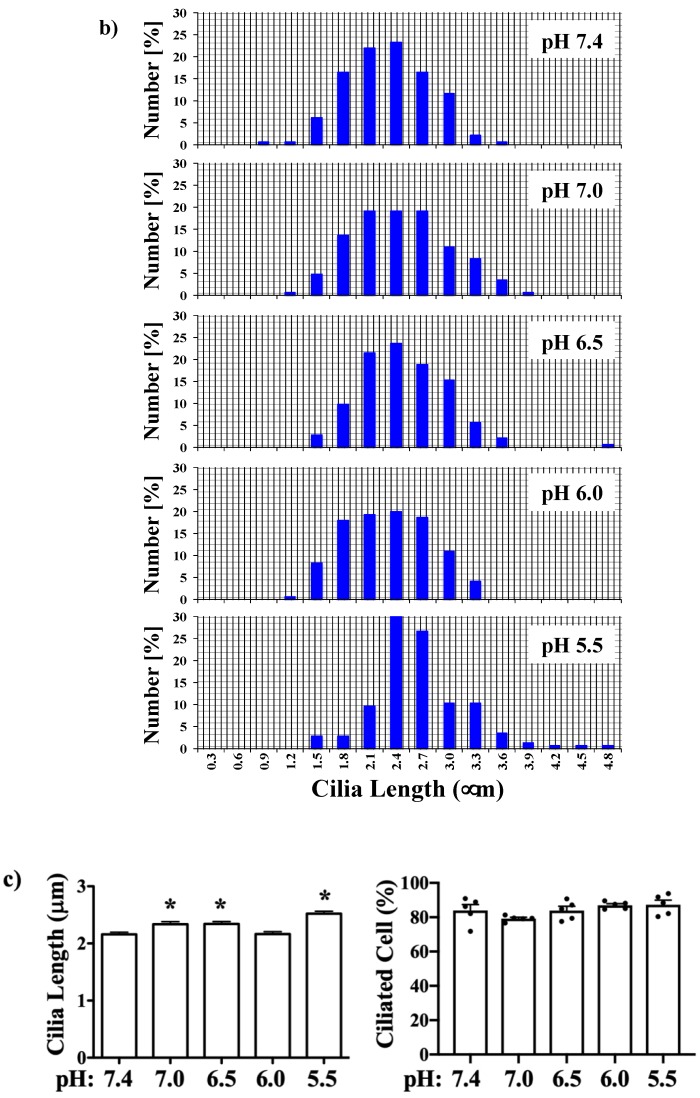
Figure 2.
Immunofluorescence staining to study effects of pHo on primary cilia. (a) Cells (wild-type and Tg737) were stained with ciliary marker (acetylated-α-tubulin; green) and nucleus marker (DAPI; blue). Representative images are shown for wild-type cells at different pHo and Tg737 at pHo 7.4. White boxes show enlargement of the images to depict the presence of primary cilia. (b) The lengths of primary cilia from 50 cells were measured from each preparation (N = 3) and illustrated in the bar graph to depict length distribution within each pHo. (c) Cilia length was averaged from 150 cells (N = 3; each with 50 randomly selected cells) and the number of cells possessing cilia represented as a percentage with each point representing an individual experimental datapoint. * indicates a significant difference to control pHo 7.4.


