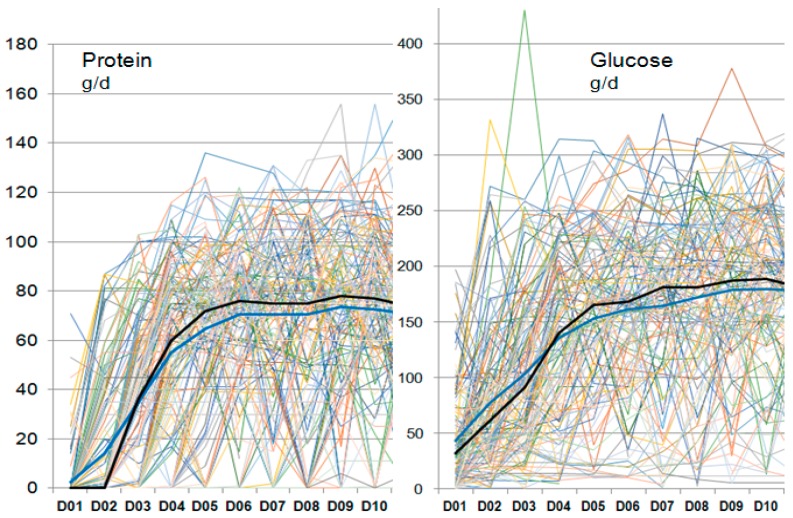
Figure 3.
Individual delivery of protein and glucose by day during the first 10 days. Each line represents individual patient values. The erratic aspect aims at showing a phenomenon which is the extreme day to day variability and multiple interruptions that characterize the nutrition in the early phase. The thick dark lines show median (blue) and mean (black) values.

