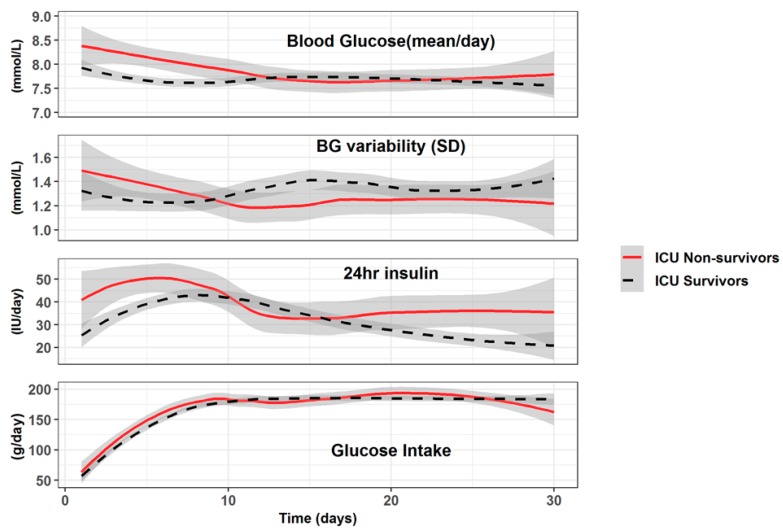
Figure 5.
Evolution of mean blood glucose (mmol/L), Blood Glucose (BG) variability (standard error = SD of the individual daily values), 24 h insulin (total dose/24 h), and glucose intake (total in g/day). The figure shows that the 24 h Insulin delivery is not related to the glucose intake, which was similar in both groups (data are represented as mean ± SD).

