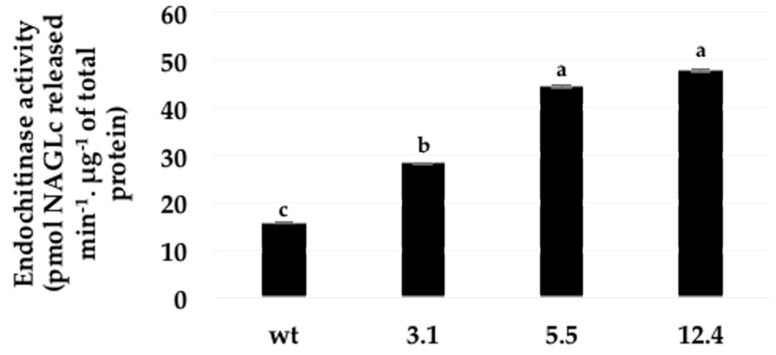
Figure 4.
Endochitinase activity in crude leaves extracts of three different transgenic lines and untransformed (wt) plant. Error bars indicate standard deviation of means (SD). Within each frame different letters indicate statistically significant differences among transgenic lines (p = <0.0001), n = 4.

