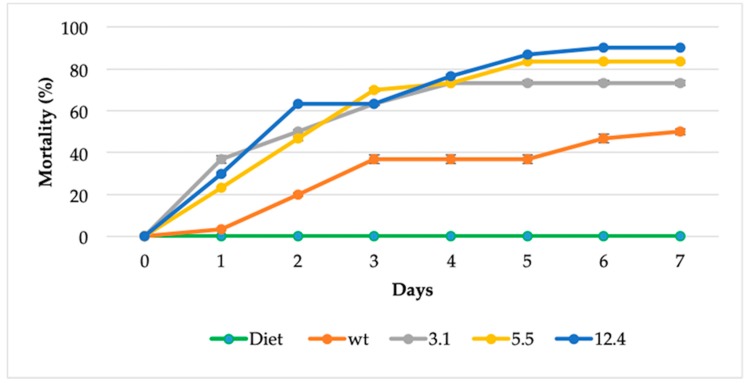
Figure 7.
Toxicity of transgenic plants to S. frugiperda larvae on a plant-feeding assay. The data shown represent the mean of three independent experiments, and error bars indicate standard deviation of means (SD). Each experimental group was composed of 10 larvae and larvae mortality is reported as a percentage of the initial number of larvae. Diet is food for rearing S. frugiperda. The survival curve was significantly different from transgenic lines versus non-transformed plant (One way ANOVA, Tukey’s test, p < 0.0001).

