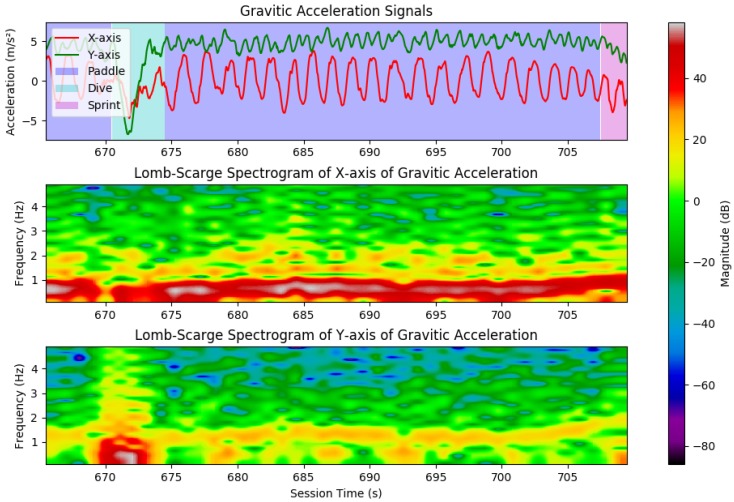
Figure 3.
Segment of surf session, evidencing paddle periods and dive moments: (Top) the X and Y components of gravitic acceleration, with background color as the output of the laying events classification block; (Middle) the obtained spectrogram for the gravitic acceleration in the X-axis; and (Bottom) the obtained spectrogram for the gravitic acceleration in the Y-axis. Note the high energy content for low frequencies during paddling in the X-axis, and the peaks in low frequencies in the Y-axis during dives.

