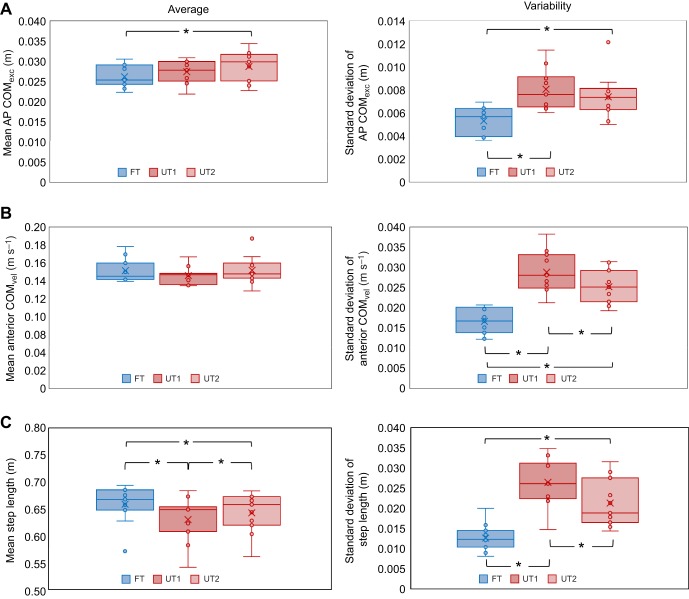
Fig. 3.
Center of mass (COM) and step dynamics in the anterior-posterior (AP) direction. Average values (mean; left) and variability (s.d.; right) across 60 strides on flat terrain (FT) and uneven terrain, at the beginning (UT1) and end (UT2) of a 12 min walking trial. Circles represent individual subject results; crosses represent the mean value. (A) Per-step COM excursion range (COMexc), (B) per-step peak anterior COM velocity (COMvel) and (C) step length. N=11, *P<0.05, in post hoc Tukey's HSD/Wilcoxon signed rank (for average anterior COMvel only) tests.

