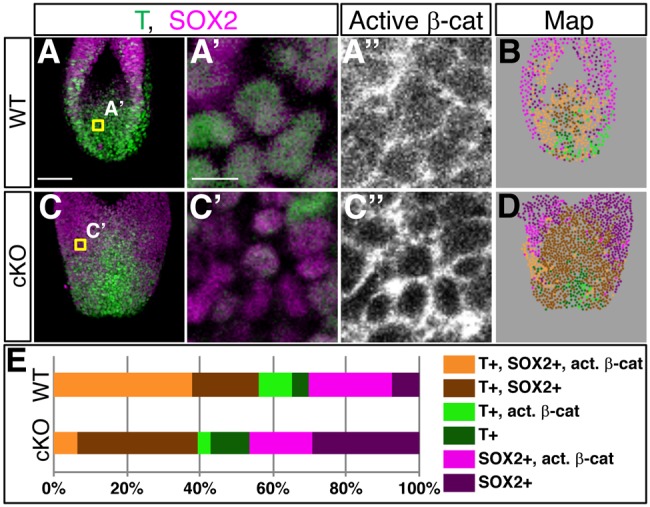
Fig. 4.

Downregulation of WNT/β-catenin signaling in Sall4 cKO embryos. (A,C) Stacked confocal images of whole-mount-stained WT and Sall4 cKO embryos at E9.5. (A′,A″,C′,C″) Single-layer images of embryos stained for T (green), SOX2 (magenta) and active β-catenin. Shown are high magnifications of single-layer images in the areas indicated in A or C. (B,D) Stacked maps of cells with different combinations of T, SOX2 and active β-catenin with the color code shown in E. (E) Quantification of cells with different combinations of T, SOX2 and active β-catenin (as shown in B and D). n=4 for WT, n=3 for Sall4 cKO. Scale bars: 100 µm (A,C); 10 µm (A′,A″,C′,C″).
