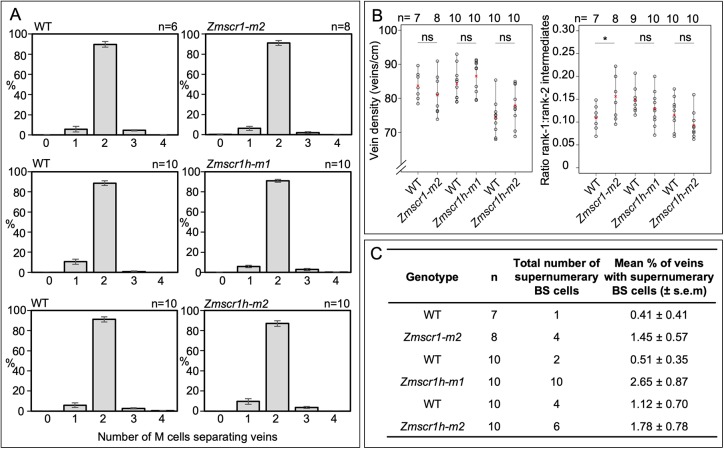
Fig. 3.
Phenotype of Zmscr1 and Zmscr1h single mutants. (A) Quantification of mean percentage of M cells between vein pairs. In each case, the wild-type plot on the left represents a segregating sibling from the same family as the mutant presented in the corresponding plot on the right. Data are mean±s.e.m. (B) Quantification of vein density and the ratio of rank1 to rank 2 intermediate veins in leaf 5. In each case, data from segregating wild type (left) and corresponding mutant (right) are presented. Means are indicated by red crosses. Statistical significance between wild type and mutant was assessed using Student's t-test (two-tailed). ns, no significant difference; *P≤0.05. (C) Quantification of mean number of supernumerary BS cells in leaf 5. In each case, data from segregating wild type (top) and corresponding mutant (bottom) are presented. Raw phenotypic data are provided in Table S1.

