Fig. 5.
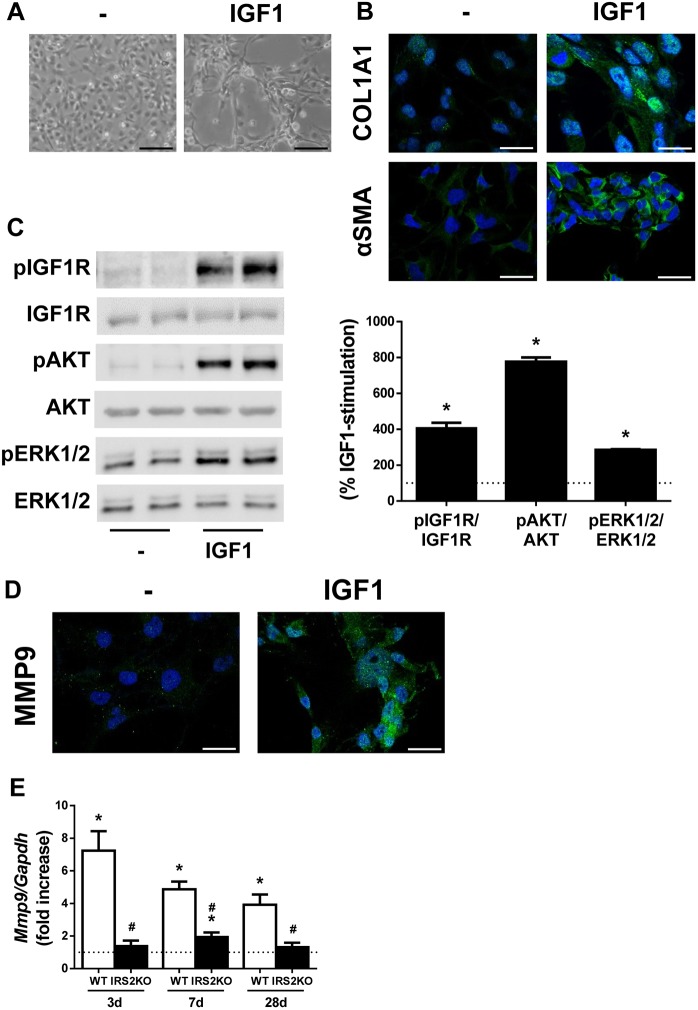
IGF1 induces the activation of LX2 cells. LX2 cells were treated with 10 nM IGF1 for 24 h (A,B,D) or 15 min (C). (A) Representative phase-contrast images of LX2 cells. (B) Representative images of LX2 cells after immunofluorescence staining for COL1A1 and αSMA. Nuclei are stained blue with DAPI. (C) Representative western blots with the indicated antibodies (left) and their quantification (right). Statistical significance was assessed by unpaired two-tailed Student's t-test: *P<0.05, IGF1 versus untreated cells (n=5 independent experiments performed in duplicate). (D) Representative images of LX2 cells after immunofluorescence staining for MMP9. Nuclei are stained blue with DAPI. (E) Mmp9 mRNA levels determined by RT-qPCR. Wild-type (WT) and Irs2-deficient (IRS2KO) female mice submitted to BDL or sham operated and analyzed at the indicated time-periods. Statistical significance was assessed by one-way ANOVA and Bonferroni post-test: *P<0.05, BDL versus sham; #P<0.05, IRS2KO versus WT (n=6–8 animals per condition). Scale bars: 100 μm (A) and 25 μm (B,D).

