Fig. 3.
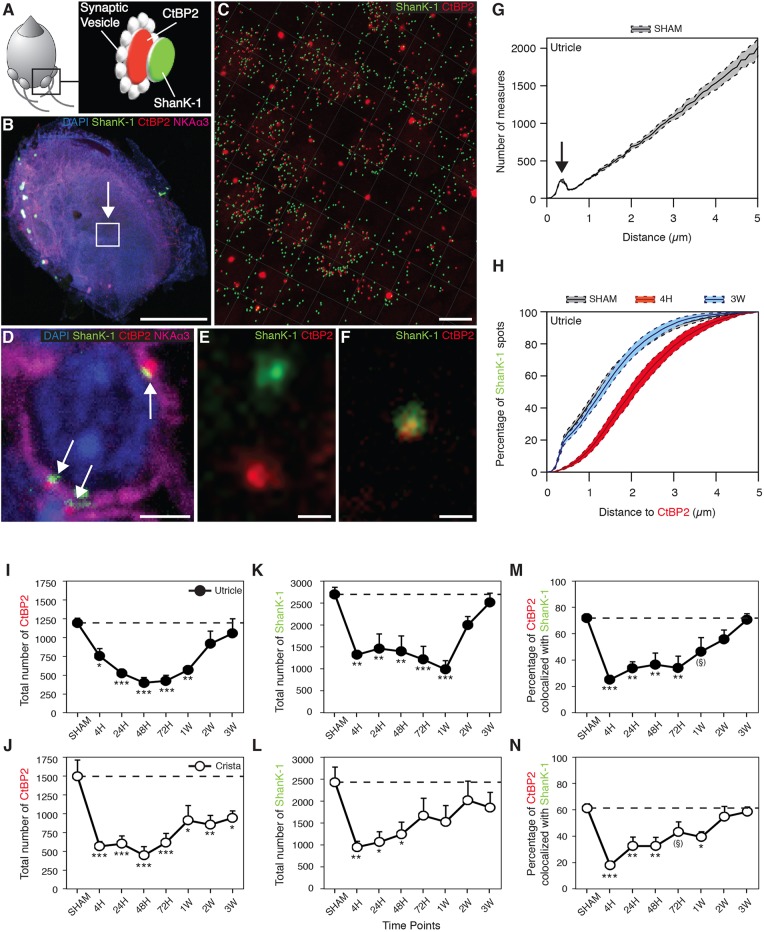
Evaluation of synaptic protein expression following TTK administration. (A) Schematised vestibular bouton synapses with the respective locations of immunostained CtBP2 (red) and SHANK-1 (green) proteins. (B) Observation field (arrowed box) of 4.5e−03 mm2, which includes about 75-100 hair cells in the centre of a utricle. (C) CtBP2 and SHANK-1 fluorescent spots semi-automatically detected within the observation field using IMARIS software. (D) Characteristic expression of fluorescent spots at a calyx terminal (white arrows). (E) Distant and (F) colocalised spots at high magnification. (G) Repartition of the distances between all CtBP2 and SHANK-1 fluorescent spots highlighting a specific subpopulation of spots, the interdistances of which are located within 1 μm (arrow). Images in B-D,F,G: control utricles. (H) Cumulative distances between CtBP2 and SHANK-1 before (sham), 4 h and 3 weeks after TTK application. Note that the gray sham data overlap with the 3 week data. (I-N) Expression of CtBP2 (I,J), SHANK-1 (K,L) and the percentage of their colocalisation (M,N) at each time point before and after TTK application in both the utricle (black circles; n=6 for 48 h, 72 h and 2 weeks; n=5 for sham, 24 h and 3 weeks; n=4 for 4 h and 1 week) and crista ampullaris (white circles; n=6 for 4 h, 72 h and 3 weeks; n=5 for sham, 24 h, 48 h, 1 week and 2 weeks). The ribbon counts were normalised relative to the observation field described in the Materials and Methods section. Results are expressed as mean±s.e.m. Dotted lines represent sham values. ANOVA followed by Dunnett post-hoc analyses were performed to compare each time point to the sham: *P<0.05; **P<0.01; ***P<0.001; (§)P=0.6. Scale bars: 200 µm (B), 5 µm (C), 2 µm (D) and 0.5 µm (E,F).

